Swiss vs German Median Family Income
COMPARE
Swiss
German
Median Family Income
Median Family Income Comparison
Swiss
Germans
$104,396
MEDIAN FAMILY INCOME
70.7/ 100
METRIC RATING
159th/ 347
METRIC RANK
$102,254
MEDIAN FAMILY INCOME
44.6/ 100
METRIC RATING
177th/ 347
METRIC RANK
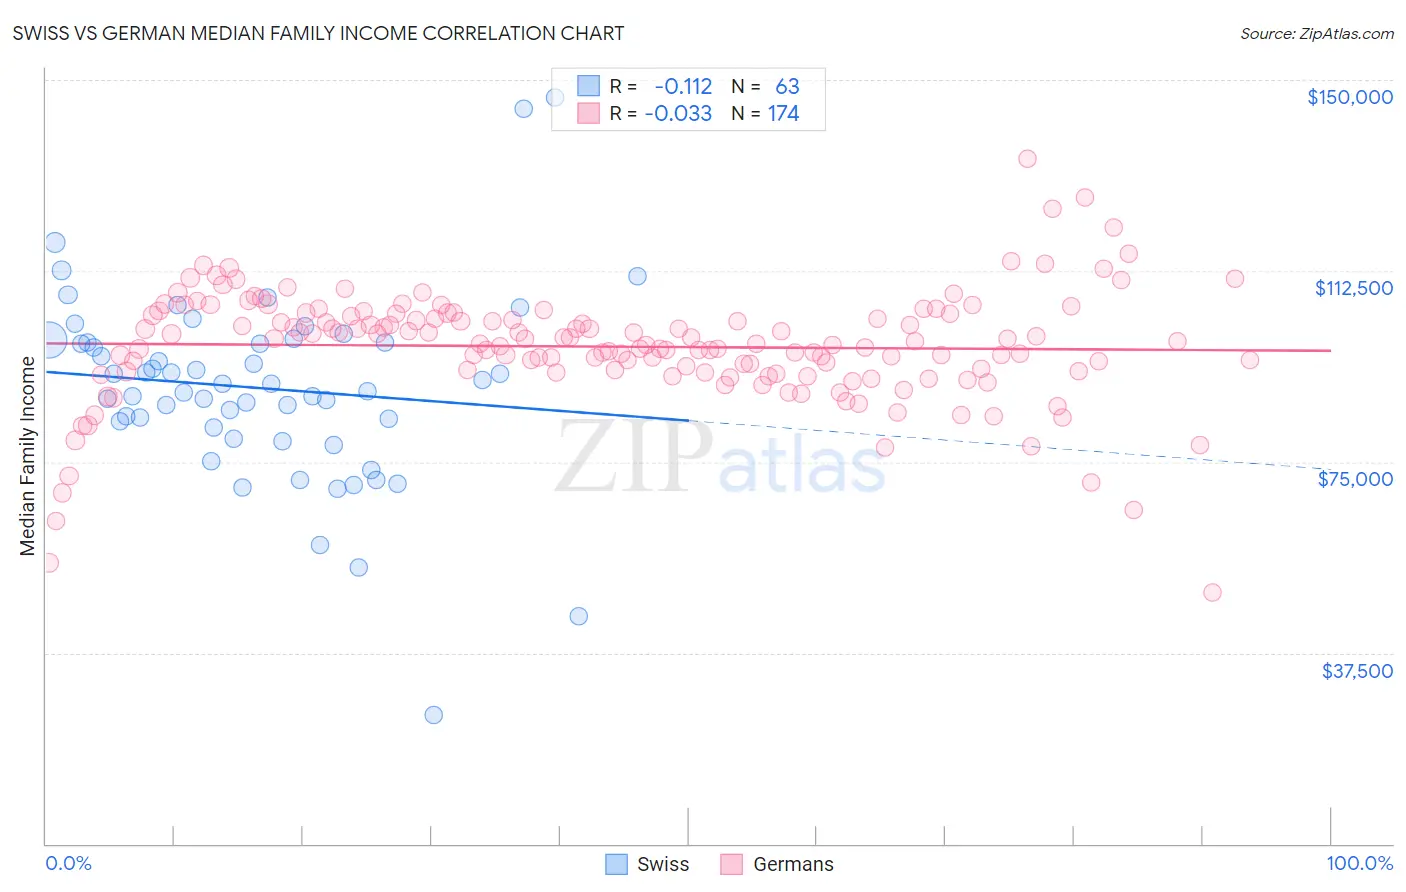
Swiss vs German Median Family Income Correlation Chart
The statistical analysis conducted on geographies consisting of 464,558,670 people shows a poor negative correlation between the proportion of Swiss and median family income in the United States with a correlation coefficient (R) of -0.112 and weighted average of $104,396. Similarly, the statistical analysis conducted on geographies consisting of 579,235,453 people shows no correlation between the proportion of Germans and median family income in the United States with a correlation coefficient (R) of -0.033 and weighted average of $102,254, a difference of 2.1%.
Median Family Income Correlation Summary
| Measurement | Swiss | German |
| Minimum | $25,401 | $49,444 |
| Maximum | $146,603 | $134,628 |
| Range | $121,202 | $85,184 |
| Mean | $89,459 | $97,641 |
| Median | $90,414 | $98,482 |
| Interquartile 25% (IQ1) | $81,791 | $92,833 |
| Interquartile 75% (IQ3) | $98,522 | $104,084 |
| Interquartile Range (IQR) | $16,731 | $11,251 |
| Standard Deviation (Sample) | $18,875 | $11,245 |
| Standard Deviation (Population) | $18,724 | $11,212 |
Demographics Similar to Swiss and Germans by Median Family Income
In terms of median family income, the demographic groups most similar to Swiss are Scandinavian ($104,410, a difference of 0.010%), Scottish ($104,288, a difference of 0.10%), Icelander ($104,282, a difference of 0.11%), Immigrants from Sierra Leone ($103,990, a difference of 0.39%), and Costa Rican ($103,989, a difference of 0.39%). Similarly, the demographic groups most similar to Germans are Welsh ($102,151, a difference of 0.10%), French ($102,368, a difference of 0.11%), Immigrants from Eastern Africa ($102,451, a difference of 0.19%), Finnish ($102,676, a difference of 0.41%), and Belgian ($102,788, a difference of 0.52%).
| Demographics | Rating | Rank | Median Family Income |
| Scandinavians | 70.8 /100 | #158 | Good $104,410 |
| Swiss | 70.7 /100 | #159 | Good $104,396 |
| Scottish | 69.5 /100 | #160 | Good $104,288 |
| Icelanders | 69.4 /100 | #161 | Good $104,282 |
| Immigrants | Sierra Leone | 66.2 /100 | #162 | Good $103,990 |
| Costa Ricans | 66.2 /100 | #163 | Good $103,989 |
| Sierra Leoneans | 64.7 /100 | #164 | Good $103,859 |
| Slovaks | 63.1 /100 | #165 | Good $103,729 |
| English | 62.6 /100 | #166 | Good $103,684 |
| South American Indians | 61.9 /100 | #167 | Good $103,624 |
| Immigrants | Peru | 60.8 /100 | #168 | Good $103,534 |
| Czechoslovakians | 57.6 /100 | #169 | Average $103,273 |
| Immigrants | Uzbekistan | 56.6 /100 | #170 | Average $103,197 |
| Alsatians | 54.3 /100 | #171 | Average $103,010 |
| Immigrants | Eritrea | 51.9 /100 | #172 | Average $102,823 |
| Belgians | 51.4 /100 | #173 | Average $102,788 |
| Finns | 50.0 /100 | #174 | Average $102,676 |
| Immigrants | Eastern Africa | 47.1 /100 | #175 | Average $102,451 |
| French | 46.1 /100 | #176 | Average $102,368 |
| Germans | 44.6 /100 | #177 | Average $102,254 |
| Welsh | 43.3 /100 | #178 | Average $102,151 |