Swiss vs Immigrants from Zaire Householder Income Ages 45 - 64 years
COMPARE
Swiss
Immigrants from Zaire
Householder Income Ages 45 - 64 years
Householder Income Ages 45 - 64 years Comparison
Swiss
Immigrants from Zaire
$103,071
HOUSEHOLDER INCOME AGES 45 - 64 YEARS
79.9/ 100
METRIC RATING
151st/ 347
METRIC RANK
$85,207
HOUSEHOLDER INCOME AGES 45 - 64 YEARS
0.1/ 100
METRIC RATING
296th/ 347
METRIC RANK
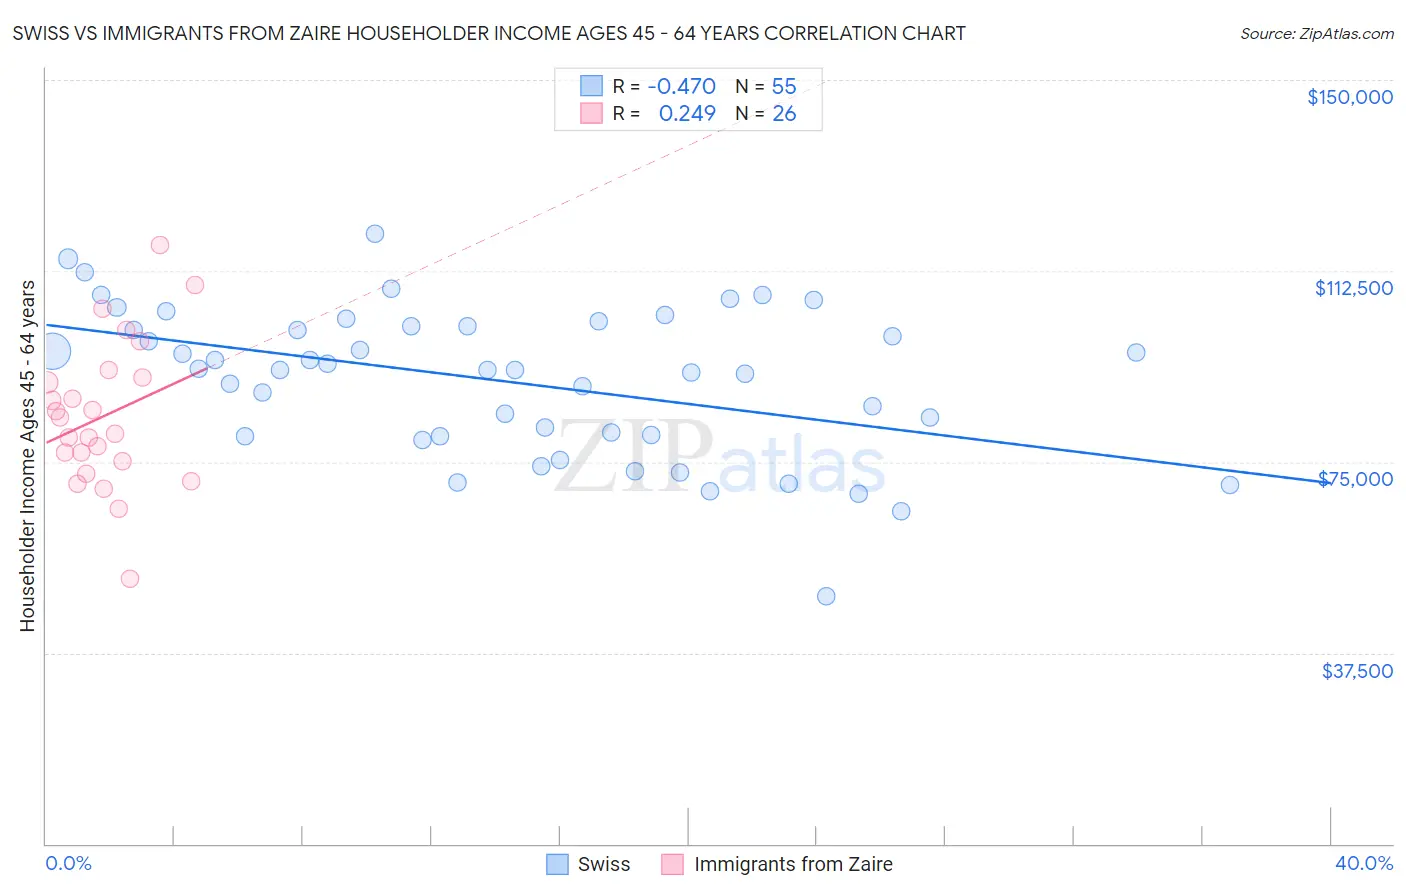
Swiss vs Immigrants from Zaire Householder Income Ages 45 - 64 years Correlation Chart
The statistical analysis conducted on geographies consisting of 463,835,295 people shows a moderate negative correlation between the proportion of Swiss and household income with householder between the ages 45 and 64 in the United States with a correlation coefficient (R) of -0.470 and weighted average of $103,071. Similarly, the statistical analysis conducted on geographies consisting of 107,222,169 people shows a weak positive correlation between the proportion of Immigrants from Zaire and household income with householder between the ages 45 and 64 in the United States with a correlation coefficient (R) of 0.249 and weighted average of $85,207, a difference of 21.0%.
Householder Income Ages 45 - 64 years Correlation Summary
| Measurement | Swiss | Immigrants from Zaire |
| Minimum | $48,631 | $51,937 |
| Maximum | $119,830 | $117,531 |
| Range | $71,199 | $65,594 |
| Mean | $90,919 | $84,004 |
| Median | $93,146 | $82,074 |
| Interquartile 25% (IQ1) | $80,104 | $75,184 |
| Interquartile 75% (IQ3) | $101,628 | $91,518 |
| Interquartile Range (IQR) | $21,524 | $16,334 |
| Standard Deviation (Sample) | $14,599 | $14,467 |
| Standard Deviation (Population) | $14,465 | $14,186 |
Similar Demographics by Householder Income Ages 45 - 64 years
Demographics Similar to Swiss by Householder Income Ages 45 - 64 years
In terms of householder income ages 45 - 64 years, the demographic groups most similar to Swiss are Irish ($103,067, a difference of 0.0%), Immigrants from Peru ($103,173, a difference of 0.10%), Scandinavian ($102,969, a difference of 0.10%), Immigrants from Sierra Leone ($103,227, a difference of 0.15%), and Slovene ($102,885, a difference of 0.18%).
| Demographics | Rating | Rank | Householder Income Ages 45 - 64 years |
| Czechs | 83.1 /100 | #144 | Excellent $103,507 |
| Ugandans | 82.9 /100 | #145 | Excellent $103,472 |
| Immigrants | Chile | 82.5 /100 | #146 | Excellent $103,412 |
| Basques | 82.3 /100 | #147 | Excellent $103,387 |
| Immigrants | Germany | 81.5 /100 | #148 | Excellent $103,282 |
| Immigrants | Sierra Leone | 81.1 /100 | #149 | Excellent $103,227 |
| Immigrants | Peru | 80.7 /100 | #150 | Excellent $103,173 |
| Swiss | 79.9 /100 | #151 | Good $103,071 |
| Irish | 79.8 /100 | #152 | Good $103,067 |
| Scandinavians | 79.0 /100 | #153 | Good $102,969 |
| Slovenes | 78.3 /100 | #154 | Good $102,885 |
| Costa Ricans | 77.4 /100 | #155 | Good $102,779 |
| Carpatho Rusyns | 77.4 /100 | #156 | Good $102,777 |
| Immigrants | Ethiopia | 77.3 /100 | #157 | Good $102,763 |
| Slavs | 76.1 /100 | #158 | Good $102,629 |
Demographics Similar to Immigrants from Zaire by Householder Income Ages 45 - 64 years
In terms of householder income ages 45 - 64 years, the demographic groups most similar to Immigrants from Zaire are Fijian ($85,187, a difference of 0.020%), African ($84,925, a difference of 0.33%), Immigrants from Mexico ($84,910, a difference of 0.35%), Indonesian ($84,890, a difference of 0.37%), and Immigrants from Grenada ($85,552, a difference of 0.40%).
| Demographics | Rating | Rank | Householder Income Ages 45 - 64 years |
| Cubans | 0.1 /100 | #289 | Tragic $86,301 |
| Cherokee | 0.1 /100 | #290 | Tragic $86,125 |
| Hispanics or Latinos | 0.1 /100 | #291 | Tragic $86,006 |
| Immigrants | Central America | 0.1 /100 | #292 | Tragic $85,965 |
| Comanche | 0.1 /100 | #293 | Tragic $85,787 |
| British West Indians | 0.1 /100 | #294 | Tragic $85,571 |
| Immigrants | Grenada | 0.1 /100 | #295 | Tragic $85,552 |
| Immigrants | Zaire | 0.1 /100 | #296 | Tragic $85,207 |
| Fijians | 0.1 /100 | #297 | Tragic $85,187 |
| Africans | 0.0 /100 | #298 | Tragic $84,925 |
| Immigrants | Mexico | 0.0 /100 | #299 | Tragic $84,910 |
| Indonesians | 0.0 /100 | #300 | Tragic $84,890 |
| Potawatomi | 0.0 /100 | #301 | Tragic $84,613 |
| Haitians | 0.0 /100 | #302 | Tragic $84,384 |
| Hondurans | 0.0 /100 | #303 | Tragic $84,079 |