Sudanese vs South American Indian Median Earnings
COMPARE
Sudanese
South American Indian
Median Earnings
Median Earnings Comparison
Sudanese
South American Indians
$44,419
MEDIAN EARNINGS
5.6/ 100
METRIC RATING
238th/ 347
METRIC RANK
$46,952
MEDIAN EARNINGS
67.4/ 100
METRIC RATING
162nd/ 347
METRIC RANK
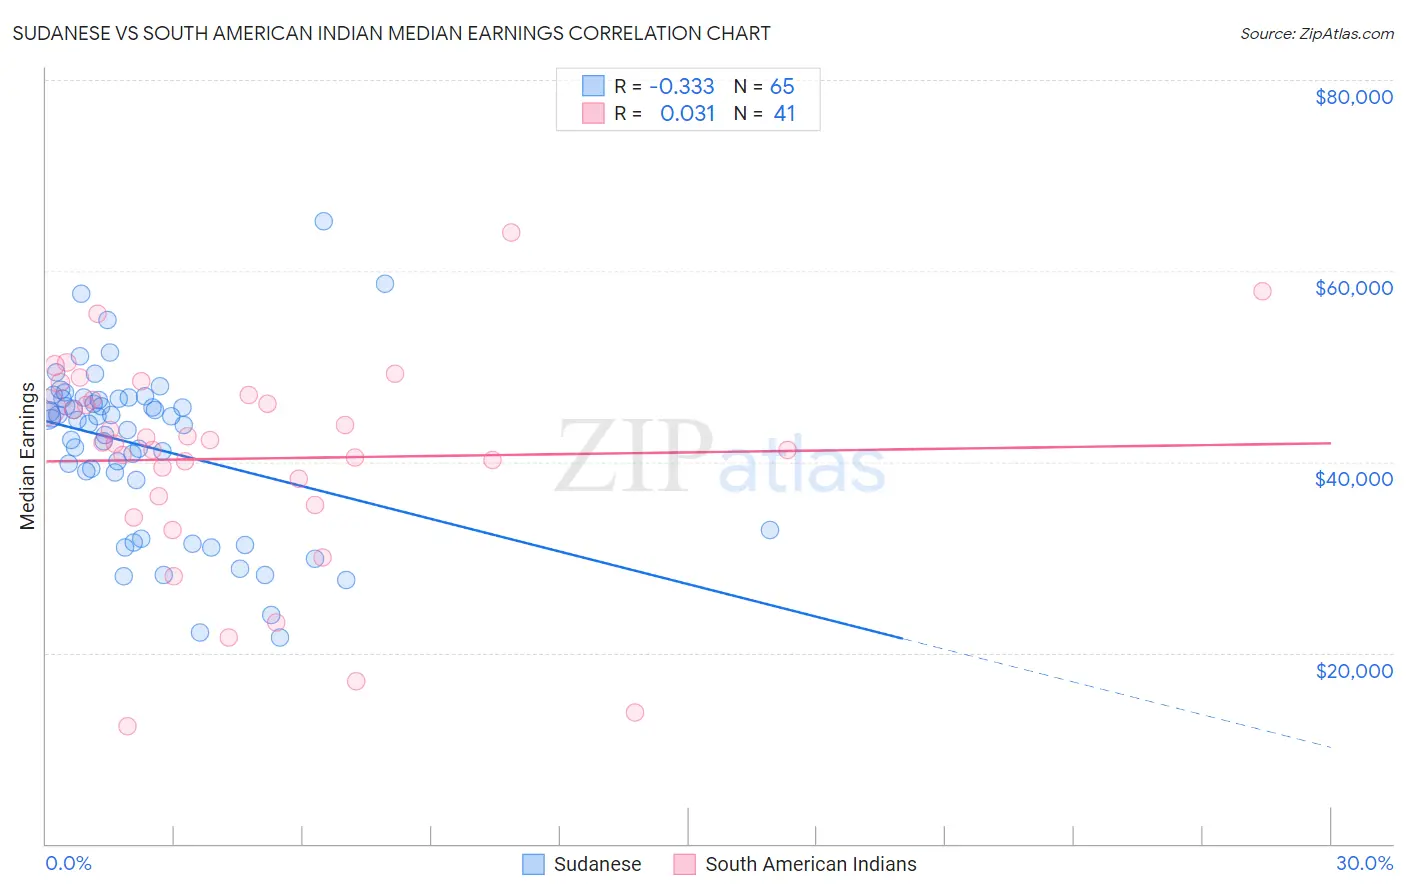
Sudanese vs South American Indian Median Earnings Correlation Chart
The statistical analysis conducted on geographies consisting of 110,129,376 people shows a mild negative correlation between the proportion of Sudanese and median earnings in the United States with a correlation coefficient (R) of -0.333 and weighted average of $44,419. Similarly, the statistical analysis conducted on geographies consisting of 164,566,845 people shows no correlation between the proportion of South American Indians and median earnings in the United States with a correlation coefficient (R) of 0.031 and weighted average of $46,952, a difference of 5.7%.
Median Earnings Correlation Summary
| Measurement | Sudanese | South American Indian |
| Minimum | $21,638 | $12,289 |
| Maximum | $65,192 | $64,091 |
| Range | $43,554 | $51,802 |
| Mean | $41,590 | $40,352 |
| Median | $44,417 | $41,992 |
| Interquartile 25% (IQ1) | $35,456 | $35,978 |
| Interquartile 75% (IQ3) | $46,591 | $46,744 |
| Interquartile Range (IQR) | $11,136 | $10,766 |
| Standard Deviation (Sample) | $8,811 | $11,075 |
| Standard Deviation (Population) | $8,743 | $10,940 |
Similar Demographics by Median Earnings
Demographics Similar to Sudanese by Median Earnings
In terms of median earnings, the demographic groups most similar to Sudanese are Immigrants from Ecuador ($44,462, a difference of 0.10%), Senegalese ($44,373, a difference of 0.10%), British West Indian ($44,552, a difference of 0.30%), Venezuelan ($44,580, a difference of 0.36%), and Aleut ($44,241, a difference of 0.40%).
| Demographics | Rating | Rank | Median Earnings |
| Japanese | 9.5 /100 | #231 | Tragic $44,825 |
| Delaware | 9.0 /100 | #232 | Tragic $44,783 |
| Immigrants | Sudan | 8.8 /100 | #233 | Tragic $44,767 |
| Cape Verdeans | 7.5 /100 | #234 | Tragic $44,640 |
| Venezuelans | 6.9 /100 | #235 | Tragic $44,580 |
| British West Indians | 6.7 /100 | #236 | Tragic $44,552 |
| Immigrants | Ecuador | 5.9 /100 | #237 | Tragic $44,462 |
| Sudanese | 5.6 /100 | #238 | Tragic $44,419 |
| Senegalese | 5.3 /100 | #239 | Tragic $44,373 |
| Aleuts | 4.4 /100 | #240 | Tragic $44,241 |
| Samoans | 4.2 /100 | #241 | Tragic $44,206 |
| Immigrants | Venezuela | 4.0 /100 | #242 | Tragic $44,163 |
| Sub-Saharan Africans | 3.7 /100 | #243 | Tragic $44,118 |
| Immigrants | Nonimmigrants | 3.7 /100 | #244 | Tragic $44,117 |
| Immigrants | Burma/Myanmar | 3.2 /100 | #245 | Tragic $43,998 |
Demographics Similar to South American Indians by Median Earnings
In terms of median earnings, the demographic groups most similar to South American Indians are Immigrants from Eastern Africa ($46,969, a difference of 0.040%), Icelander ($46,916, a difference of 0.080%), Alsatian ($47,023, a difference of 0.15%), Immigrants from Peru ($47,025, a difference of 0.16%), and Norwegian ($46,865, a difference of 0.18%).
| Demographics | Rating | Rank | Median Earnings |
| Immigrants | Vietnam | 76.7 /100 | #155 | Good $47,282 |
| Irish | 76.6 /100 | #156 | Good $47,276 |
| Czechs | 75.1 /100 | #157 | Good $47,221 |
| Slovaks | 71.7 /100 | #158 | Good $47,095 |
| Immigrants | Peru | 69.6 /100 | #159 | Good $47,025 |
| Alsatians | 69.6 /100 | #160 | Good $47,023 |
| Immigrants | Eastern Africa | 68.0 /100 | #161 | Good $46,969 |
| South American Indians | 67.4 /100 | #162 | Good $46,952 |
| Icelanders | 66.3 /100 | #163 | Good $46,916 |
| Norwegians | 64.7 /100 | #164 | Good $46,865 |
| South Americans | 62.7 /100 | #165 | Good $46,804 |
| Czechoslovakians | 57.8 /100 | #166 | Average $46,658 |
| Costa Ricans | 57.4 /100 | #167 | Average $46,645 |
| Immigrants | Africa | 54.6 /100 | #168 | Average $46,564 |
| Immigrants | South America | 54.0 /100 | #169 | Average $46,548 |