Sudanese vs Spanish Median Earnings
COMPARE
Sudanese
Spanish
Median Earnings
Median Earnings Comparison
Sudanese
Spanish
$44,419
MEDIAN EARNINGS
5.6/ 100
METRIC RATING
238th/ 347
METRIC RANK
$45,432
MEDIAN EARNINGS
19.7/ 100
METRIC RATING
218th/ 347
METRIC RANK
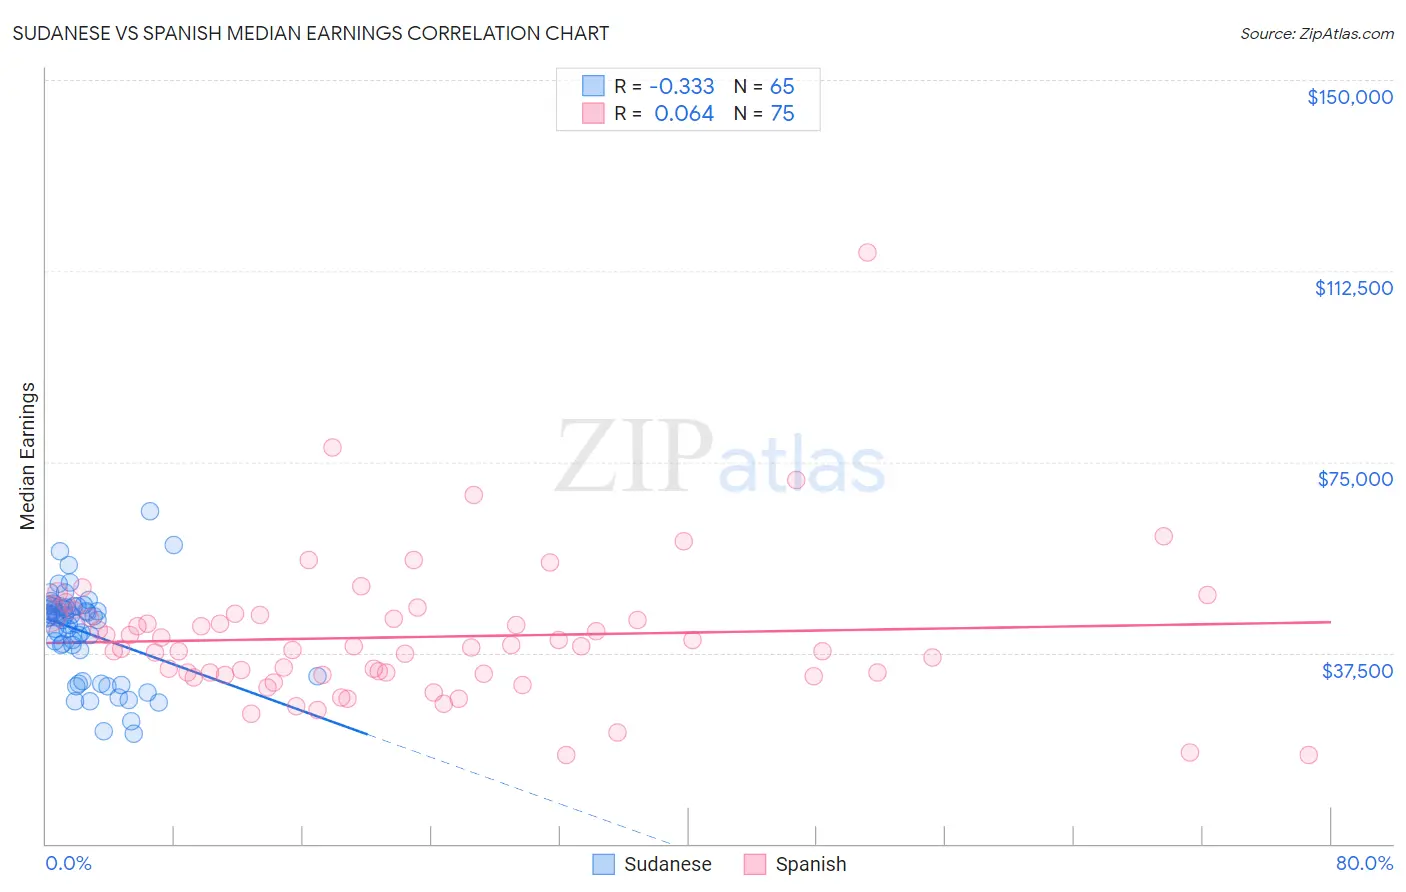
Sudanese vs Spanish Median Earnings Correlation Chart
The statistical analysis conducted on geographies consisting of 110,129,376 people shows a mild negative correlation between the proportion of Sudanese and median earnings in the United States with a correlation coefficient (R) of -0.333 and weighted average of $44,419. Similarly, the statistical analysis conducted on geographies consisting of 422,139,772 people shows a slight positive correlation between the proportion of Spanish and median earnings in the United States with a correlation coefficient (R) of 0.064 and weighted average of $45,432, a difference of 2.3%.
Median Earnings Correlation Summary
| Measurement | Sudanese | Spanish |
| Minimum | $21,638 | $17,367 |
| Maximum | $65,192 | $116,081 |
| Range | $43,554 | $98,714 |
| Mean | $41,590 | $40,595 |
| Median | $44,417 | $38,434 |
| Interquartile 25% (IQ1) | $35,456 | $33,070 |
| Interquartile 75% (IQ3) | $46,591 | $44,875 |
| Interquartile Range (IQR) | $11,136 | $11,804 |
| Standard Deviation (Sample) | $8,811 | $14,293 |
| Standard Deviation (Population) | $8,743 | $14,198 |
Demographics Similar to Sudanese and Spanish by Median Earnings
In terms of median earnings, the demographic groups most similar to Sudanese are Immigrants from Ecuador ($44,462, a difference of 0.10%), British West Indian ($44,552, a difference of 0.30%), Venezuelan ($44,580, a difference of 0.36%), Cape Verdean ($44,640, a difference of 0.50%), and Immigrants from Sudan ($44,767, a difference of 0.78%). Similarly, the demographic groups most similar to Spanish are Dutch ($45,370, a difference of 0.14%), Ecuadorian ($45,214, a difference of 0.48%), Immigrants from Guyana ($45,204, a difference of 0.50%), Immigrants from Panama ($45,198, a difference of 0.52%), and White/Caucasian ($45,197, a difference of 0.52%).
| Demographics | Rating | Rank | Median Earnings |
| Spanish | 19.7 /100 | #218 | Poor $45,432 |
| Dutch | 18.4 /100 | #219 | Poor $45,370 |
| Ecuadorians | 15.3 /100 | #220 | Poor $45,214 |
| Immigrants | Guyana | 15.1 /100 | #221 | Poor $45,204 |
| Immigrants | Panama | 15.0 /100 | #222 | Poor $45,198 |
| Whites/Caucasians | 15.0 /100 | #223 | Poor $45,197 |
| West Indians | 13.9 /100 | #224 | Poor $45,132 |
| Immigrants | Cambodia | 13.2 /100 | #225 | Poor $45,090 |
| Immigrants | Nigeria | 12.2 /100 | #226 | Poor $45,030 |
| Native Hawaiians | 12.2 /100 | #227 | Poor $45,027 |
| Immigrants | Iraq | 11.6 /100 | #228 | Poor $44,988 |
| Scotch-Irish | 10.7 /100 | #229 | Poor $44,924 |
| Immigrants | Western Africa | 10.3 /100 | #230 | Poor $44,893 |
| Japanese | 9.5 /100 | #231 | Tragic $44,825 |
| Delaware | 9.0 /100 | #232 | Tragic $44,783 |
| Immigrants | Sudan | 8.8 /100 | #233 | Tragic $44,767 |
| Cape Verdeans | 7.5 /100 | #234 | Tragic $44,640 |
| Venezuelans | 6.9 /100 | #235 | Tragic $44,580 |
| British West Indians | 6.7 /100 | #236 | Tragic $44,552 |
| Immigrants | Ecuador | 5.9 /100 | #237 | Tragic $44,462 |
| Sudanese | 5.6 /100 | #238 | Tragic $44,419 |