Hungarian vs South American Indian Median Earnings
COMPARE
Hungarian
South American Indian
Median Earnings
Median Earnings Comparison
Hungarians
South American Indians
$47,795
MEDIAN EARNINGS
87.1/ 100
METRIC RATING
144th/ 347
METRIC RANK
$46,952
MEDIAN EARNINGS
67.4/ 100
METRIC RATING
162nd/ 347
METRIC RANK
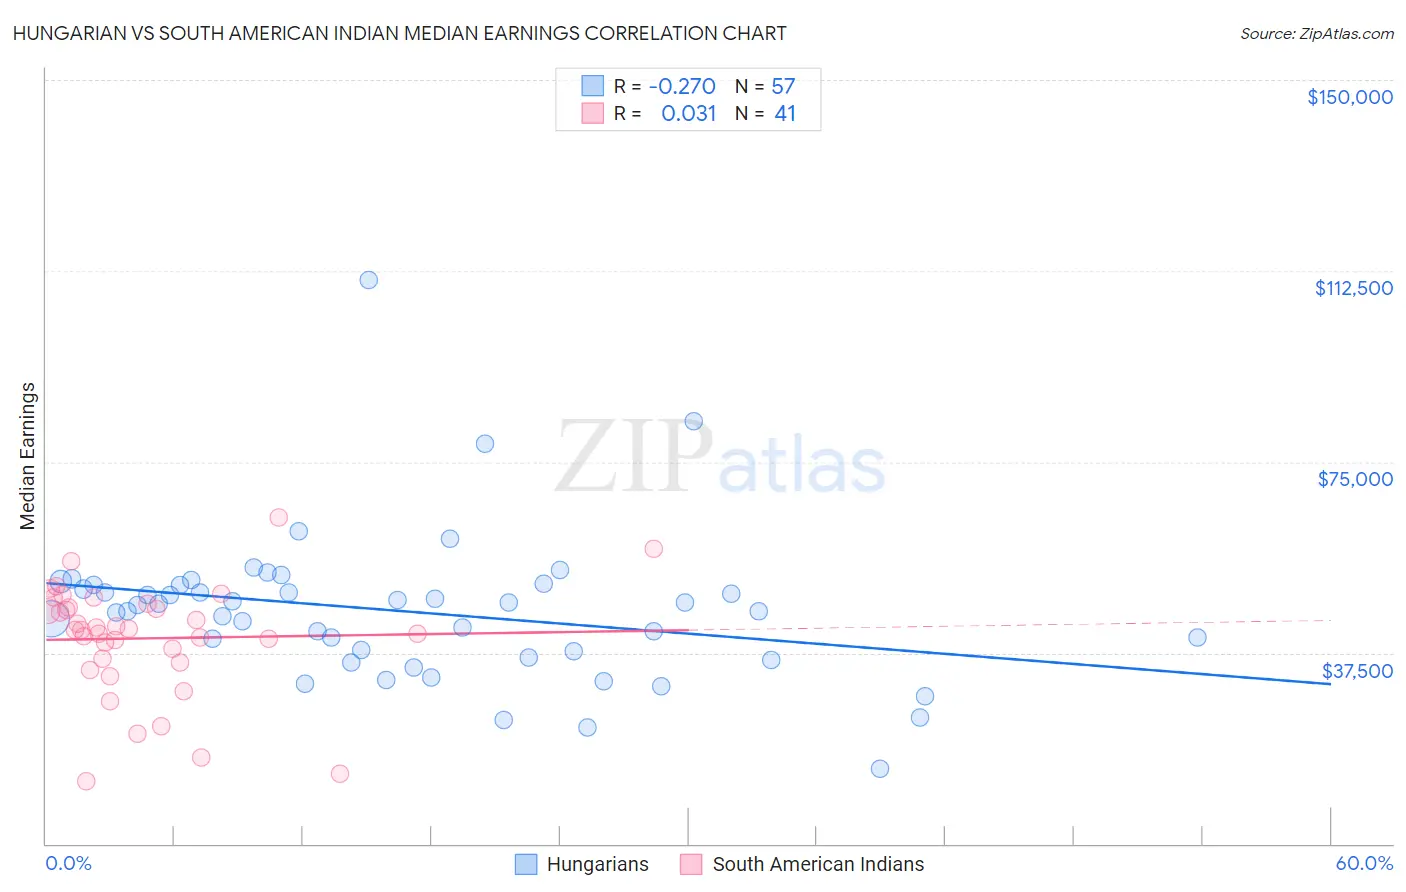
Hungarian vs South American Indian Median Earnings Correlation Chart
The statistical analysis conducted on geographies consisting of 486,158,969 people shows a weak negative correlation between the proportion of Hungarians and median earnings in the United States with a correlation coefficient (R) of -0.270 and weighted average of $47,795. Similarly, the statistical analysis conducted on geographies consisting of 164,566,845 people shows no correlation between the proportion of South American Indians and median earnings in the United States with a correlation coefficient (R) of 0.031 and weighted average of $46,952, a difference of 1.8%.
Median Earnings Correlation Summary
| Measurement | Hungarian | South American Indian |
| Minimum | $14,721 | $12,289 |
| Maximum | $110,790 | $64,091 |
| Range | $96,069 | $51,802 |
| Mean | $45,677 | $40,352 |
| Median | $46,823 | $41,992 |
| Interquartile 25% (IQ1) | $37,180 | $35,978 |
| Interquartile 75% (IQ3) | $50,813 | $46,744 |
| Interquartile Range (IQR) | $13,633 | $10,766 |
| Standard Deviation (Sample) | $14,634 | $11,075 |
| Standard Deviation (Population) | $14,505 | $10,940 |
Demographics Similar to Hungarians and South American Indians by Median Earnings
In terms of median earnings, the demographic groups most similar to Hungarians are Swedish ($47,851, a difference of 0.12%), Immigrants from Saudi Arabia ($47,704, a difference of 0.19%), Immigrants from Chile ($47,697, a difference of 0.21%), Immigrants from South Eastern Asia ($47,671, a difference of 0.26%), and Immigrants from Eritrea ($47,657, a difference of 0.29%). Similarly, the demographic groups most similar to South American Indians are Immigrants from Eastern Africa ($46,969, a difference of 0.040%), Icelander ($46,916, a difference of 0.080%), Alsatian ($47,023, a difference of 0.15%), Immigrants from Peru ($47,025, a difference of 0.16%), and Slovak ($47,095, a difference of 0.31%).
| Demographics | Rating | Rank | Median Earnings |
| Swedes | 88.0 /100 | #143 | Excellent $47,851 |
| Hungarians | 87.1 /100 | #144 | Excellent $47,795 |
| Immigrants | Saudi Arabia | 85.6 /100 | #145 | Excellent $47,704 |
| Immigrants | Chile | 85.5 /100 | #146 | Excellent $47,697 |
| Immigrants | South Eastern Asia | 85.0 /100 | #147 | Excellent $47,671 |
| Immigrants | Eritrea | 84.8 /100 | #148 | Excellent $47,657 |
| Luxembourgers | 84.5 /100 | #149 | Excellent $47,640 |
| Peruvians | 84.2 /100 | #150 | Excellent $47,628 |
| Immigrants | Oceania | 84.1 /100 | #151 | Excellent $47,617 |
| Immigrants | Germany | 83.1 /100 | #152 | Excellent $47,566 |
| Slavs | 81.1 /100 | #153 | Excellent $47,470 |
| Immigrants | Portugal | 77.3 /100 | #154 | Good $47,304 |
| Immigrants | Vietnam | 76.7 /100 | #155 | Good $47,282 |
| Irish | 76.6 /100 | #156 | Good $47,276 |
| Czechs | 75.1 /100 | #157 | Good $47,221 |
| Slovaks | 71.7 /100 | #158 | Good $47,095 |
| Immigrants | Peru | 69.6 /100 | #159 | Good $47,025 |
| Alsatians | 69.6 /100 | #160 | Good $47,023 |
| Immigrants | Eastern Africa | 68.0 /100 | #161 | Good $46,969 |
| South American Indians | 67.4 /100 | #162 | Good $46,952 |
| Icelanders | 66.3 /100 | #163 | Good $46,916 |