Sudanese vs Belizean Median Earnings
COMPARE
Sudanese
Belizean
Median Earnings
Median Earnings Comparison
Sudanese
Belizeans
$44,419
MEDIAN EARNINGS
5.6/ 100
METRIC RATING
238th/ 347
METRIC RANK
$42,702
MEDIAN EARNINGS
0.5/ 100
METRIC RATING
269th/ 347
METRIC RANK
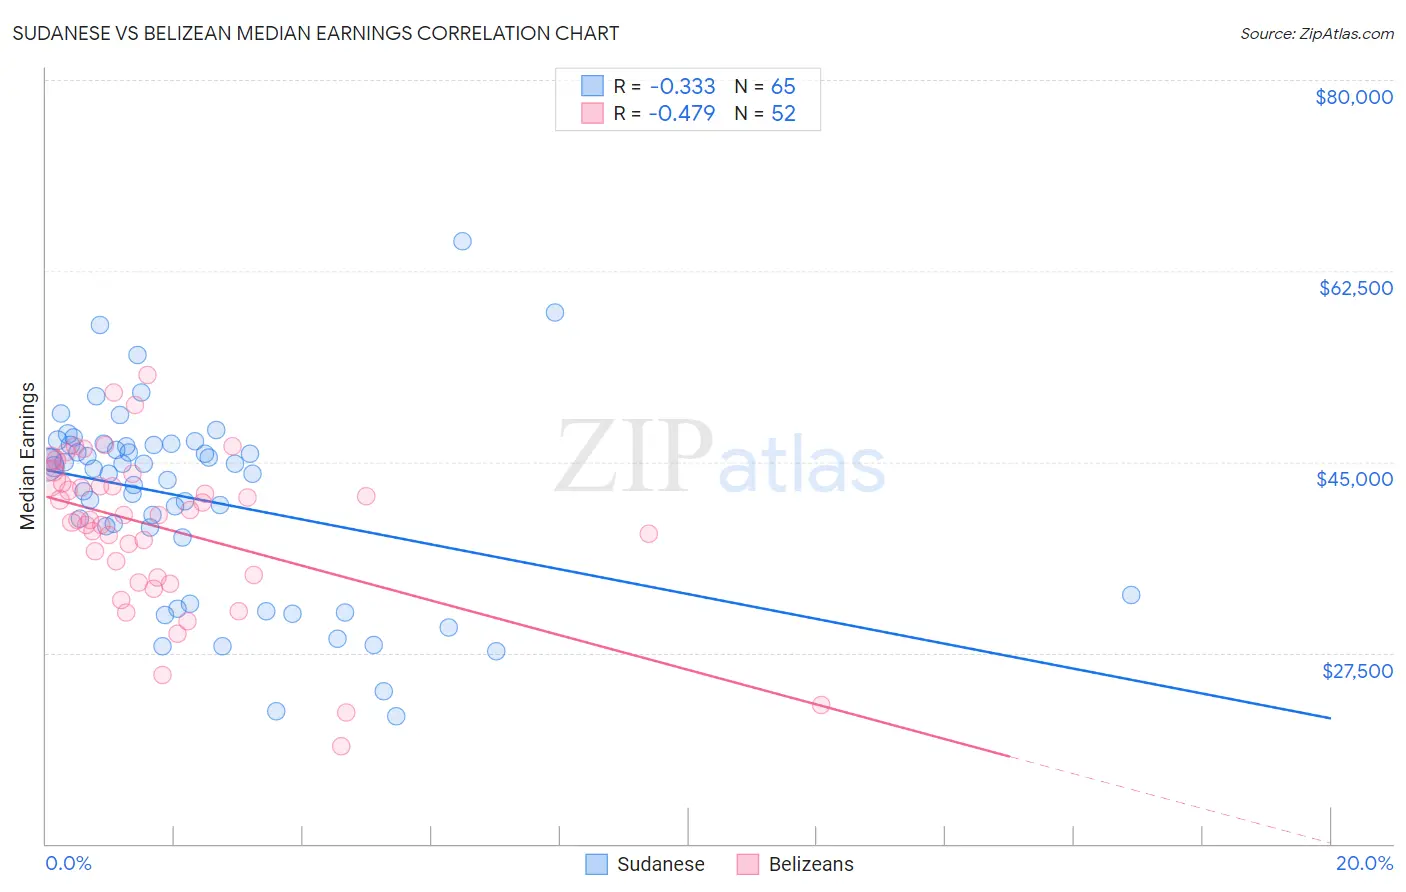
Sudanese vs Belizean Median Earnings Correlation Chart
The statistical analysis conducted on geographies consisting of 110,129,376 people shows a mild negative correlation between the proportion of Sudanese and median earnings in the United States with a correlation coefficient (R) of -0.333 and weighted average of $44,419. Similarly, the statistical analysis conducted on geographies consisting of 144,215,704 people shows a moderate negative correlation between the proportion of Belizeans and median earnings in the United States with a correlation coefficient (R) of -0.479 and weighted average of $42,702, a difference of 4.0%.
Median Earnings Correlation Summary
| Measurement | Sudanese | Belizean |
| Minimum | $21,638 | $18,932 |
| Maximum | $65,192 | $52,967 |
| Range | $43,554 | $34,035 |
| Mean | $41,590 | $38,949 |
| Median | $44,417 | $39,910 |
| Interquartile 25% (IQ1) | $35,456 | $34,513 |
| Interquartile 75% (IQ3) | $46,591 | $43,245 |
| Interquartile Range (IQR) | $11,136 | $8,732 |
| Standard Deviation (Sample) | $8,811 | $7,165 |
| Standard Deviation (Population) | $8,743 | $7,096 |
Similar Demographics by Median Earnings
Demographics Similar to Sudanese by Median Earnings
In terms of median earnings, the demographic groups most similar to Sudanese are Immigrants from Ecuador ($44,462, a difference of 0.10%), Senegalese ($44,373, a difference of 0.10%), British West Indian ($44,552, a difference of 0.30%), Venezuelan ($44,580, a difference of 0.36%), and Aleut ($44,241, a difference of 0.40%).
| Demographics | Rating | Rank | Median Earnings |
| Japanese | 9.5 /100 | #231 | Tragic $44,825 |
| Delaware | 9.0 /100 | #232 | Tragic $44,783 |
| Immigrants | Sudan | 8.8 /100 | #233 | Tragic $44,767 |
| Cape Verdeans | 7.5 /100 | #234 | Tragic $44,640 |
| Venezuelans | 6.9 /100 | #235 | Tragic $44,580 |
| British West Indians | 6.7 /100 | #236 | Tragic $44,552 |
| Immigrants | Ecuador | 5.9 /100 | #237 | Tragic $44,462 |
| Sudanese | 5.6 /100 | #238 | Tragic $44,419 |
| Senegalese | 5.3 /100 | #239 | Tragic $44,373 |
| Aleuts | 4.4 /100 | #240 | Tragic $44,241 |
| Samoans | 4.2 /100 | #241 | Tragic $44,206 |
| Immigrants | Venezuela | 4.0 /100 | #242 | Tragic $44,163 |
| Sub-Saharan Africans | 3.7 /100 | #243 | Tragic $44,118 |
| Immigrants | Nonimmigrants | 3.7 /100 | #244 | Tragic $44,117 |
| Immigrants | Burma/Myanmar | 3.2 /100 | #245 | Tragic $43,998 |
Demographics Similar to Belizeans by Median Earnings
In terms of median earnings, the demographic groups most similar to Belizeans are American ($42,742, a difference of 0.090%), Osage ($42,651, a difference of 0.12%), Cree ($42,777, a difference of 0.17%), Pennsylvania German ($42,615, a difference of 0.21%), and Immigrants from Laos ($42,884, a difference of 0.43%).
| Demographics | Rating | Rank | Median Earnings |
| Nicaraguans | 0.8 /100 | #262 | Tragic $43,026 |
| Inupiat | 0.8 /100 | #263 | Tragic $43,000 |
| Immigrants | Liberia | 0.7 /100 | #264 | Tragic $42,923 |
| Salvadorans | 0.7 /100 | #265 | Tragic $42,912 |
| Immigrants | Laos | 0.7 /100 | #266 | Tragic $42,884 |
| Cree | 0.6 /100 | #267 | Tragic $42,777 |
| Americans | 0.6 /100 | #268 | Tragic $42,742 |
| Belizeans | 0.5 /100 | #269 | Tragic $42,702 |
| Osage | 0.5 /100 | #270 | Tragic $42,651 |
| Pennsylvania Germans | 0.5 /100 | #271 | Tragic $42,615 |
| Iroquois | 0.4 /100 | #272 | Tragic $42,430 |
| Immigrants | Dominica | 0.4 /100 | #273 | Tragic $42,420 |
| Immigrants | El Salvador | 0.4 /100 | #274 | Tragic $42,413 |
| Immigrants | Belize | 0.3 /100 | #275 | Tragic $42,339 |
| Spanish Americans | 0.3 /100 | #276 | Tragic $42,316 |