Cree vs South American Indian Median Earnings
COMPARE
Cree
South American Indian
Median Earnings
Median Earnings Comparison
Cree
South American Indians
$42,777
MEDIAN EARNINGS
0.6/ 100
METRIC RATING
267th/ 347
METRIC RANK
$46,952
MEDIAN EARNINGS
67.4/ 100
METRIC RATING
162nd/ 347
METRIC RANK
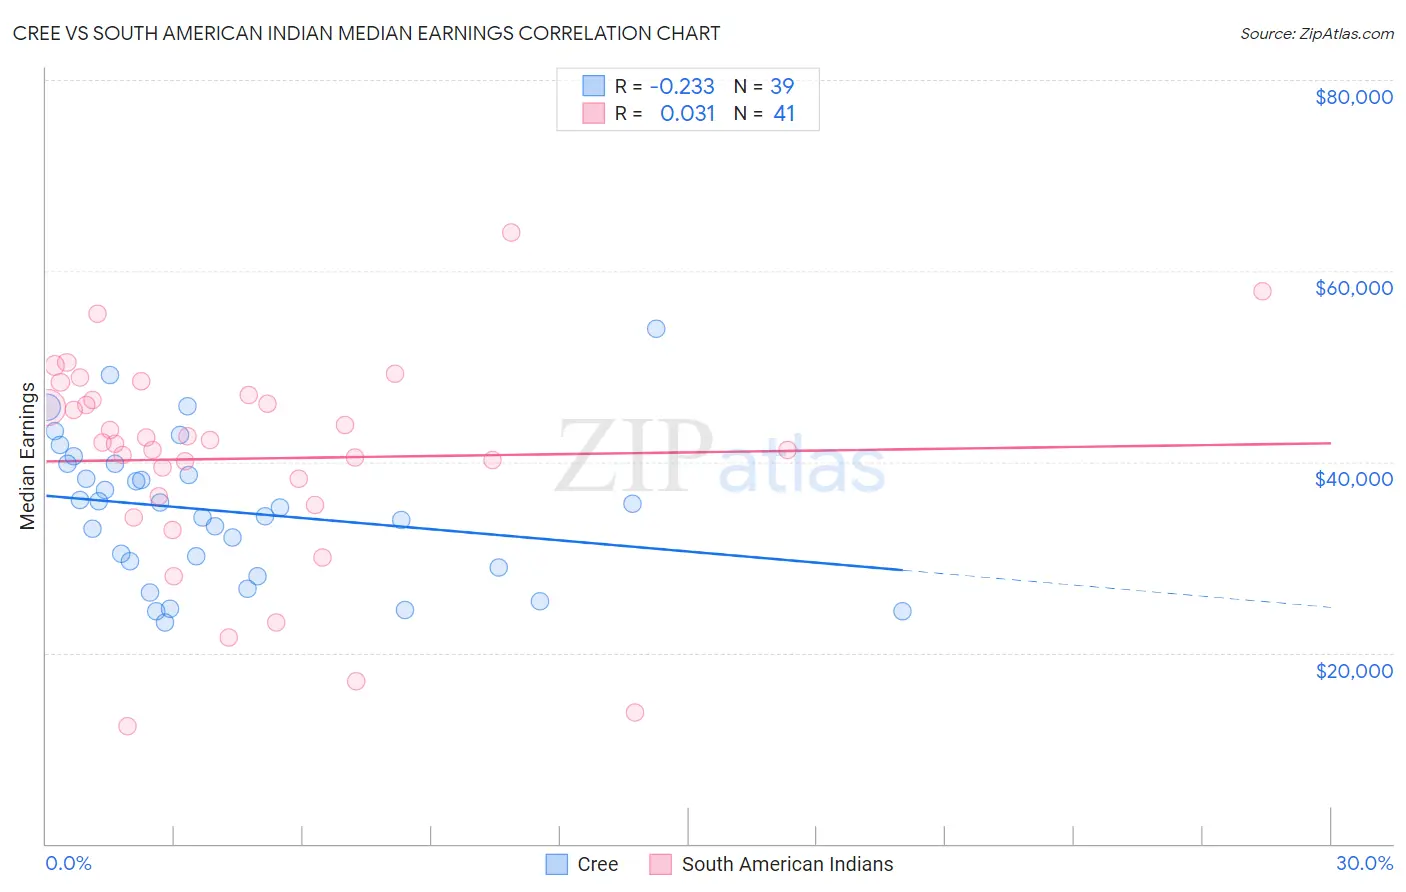
Cree vs South American Indian Median Earnings Correlation Chart
The statistical analysis conducted on geographies consisting of 76,210,467 people shows a weak negative correlation between the proportion of Cree and median earnings in the United States with a correlation coefficient (R) of -0.233 and weighted average of $42,777. Similarly, the statistical analysis conducted on geographies consisting of 164,566,845 people shows no correlation between the proportion of South American Indians and median earnings in the United States with a correlation coefficient (R) of 0.031 and weighted average of $46,952, a difference of 9.8%.
Median Earnings Correlation Summary
| Measurement | Cree | South American Indian |
| Minimum | $23,200 | $12,289 |
| Maximum | $53,900 | $64,091 |
| Range | $30,700 | $51,802 |
| Mean | $34,814 | $40,352 |
| Median | $35,233 | $41,992 |
| Interquartile 25% (IQ1) | $28,896 | $35,978 |
| Interquartile 75% (IQ3) | $39,775 | $46,744 |
| Interquartile Range (IQR) | $10,879 | $10,766 |
| Standard Deviation (Sample) | $7,415 | $11,075 |
| Standard Deviation (Population) | $7,320 | $10,940 |
Similar Demographics by Median Earnings
Demographics Similar to Cree by Median Earnings
In terms of median earnings, the demographic groups most similar to Cree are American ($42,742, a difference of 0.080%), Belizean ($42,702, a difference of 0.17%), Immigrants from Laos ($42,884, a difference of 0.25%), Osage ($42,651, a difference of 0.29%), and Salvadoran ($42,912, a difference of 0.32%).
| Demographics | Rating | Rank | Median Earnings |
| Immigrants | Somalia | 0.9 /100 | #260 | Tragic $43,100 |
| Immigrants | Jamaica | 0.8 /100 | #261 | Tragic $43,026 |
| Nicaraguans | 0.8 /100 | #262 | Tragic $43,026 |
| Inupiat | 0.8 /100 | #263 | Tragic $43,000 |
| Immigrants | Liberia | 0.7 /100 | #264 | Tragic $42,923 |
| Salvadorans | 0.7 /100 | #265 | Tragic $42,912 |
| Immigrants | Laos | 0.7 /100 | #266 | Tragic $42,884 |
| Cree | 0.6 /100 | #267 | Tragic $42,777 |
| Americans | 0.6 /100 | #268 | Tragic $42,742 |
| Belizeans | 0.5 /100 | #269 | Tragic $42,702 |
| Osage | 0.5 /100 | #270 | Tragic $42,651 |
| Pennsylvania Germans | 0.5 /100 | #271 | Tragic $42,615 |
| Iroquois | 0.4 /100 | #272 | Tragic $42,430 |
| Immigrants | Dominica | 0.4 /100 | #273 | Tragic $42,420 |
| Immigrants | El Salvador | 0.4 /100 | #274 | Tragic $42,413 |
Demographics Similar to South American Indians by Median Earnings
In terms of median earnings, the demographic groups most similar to South American Indians are Immigrants from Eastern Africa ($46,969, a difference of 0.040%), Icelander ($46,916, a difference of 0.080%), Alsatian ($47,023, a difference of 0.15%), Immigrants from Peru ($47,025, a difference of 0.16%), and Norwegian ($46,865, a difference of 0.18%).
| Demographics | Rating | Rank | Median Earnings |
| Immigrants | Vietnam | 76.7 /100 | #155 | Good $47,282 |
| Irish | 76.6 /100 | #156 | Good $47,276 |
| Czechs | 75.1 /100 | #157 | Good $47,221 |
| Slovaks | 71.7 /100 | #158 | Good $47,095 |
| Immigrants | Peru | 69.6 /100 | #159 | Good $47,025 |
| Alsatians | 69.6 /100 | #160 | Good $47,023 |
| Immigrants | Eastern Africa | 68.0 /100 | #161 | Good $46,969 |
| South American Indians | 67.4 /100 | #162 | Good $46,952 |
| Icelanders | 66.3 /100 | #163 | Good $46,916 |
| Norwegians | 64.7 /100 | #164 | Good $46,865 |
| South Americans | 62.7 /100 | #165 | Good $46,804 |
| Czechoslovakians | 57.8 /100 | #166 | Average $46,658 |
| Costa Ricans | 57.4 /100 | #167 | Average $46,645 |
| Immigrants | Africa | 54.6 /100 | #168 | Average $46,564 |
| Immigrants | South America | 54.0 /100 | #169 | Average $46,548 |