Sudanese vs South American Indian In Labor Force | Age 45-54
COMPARE
Sudanese
South American Indian
In Labor Force | Age 45-54
In Labor Force | Age 45-54 Comparison
Sudanese
South American Indians
83.0%
IN LABOR FORCE | AGE 45-54
82.0/ 100
METRIC RATING
134th/ 347
METRIC RANK
82.9%
IN LABOR FORCE | AGE 45-54
62.2/ 100
METRIC RATING
161st/ 347
METRIC RANK
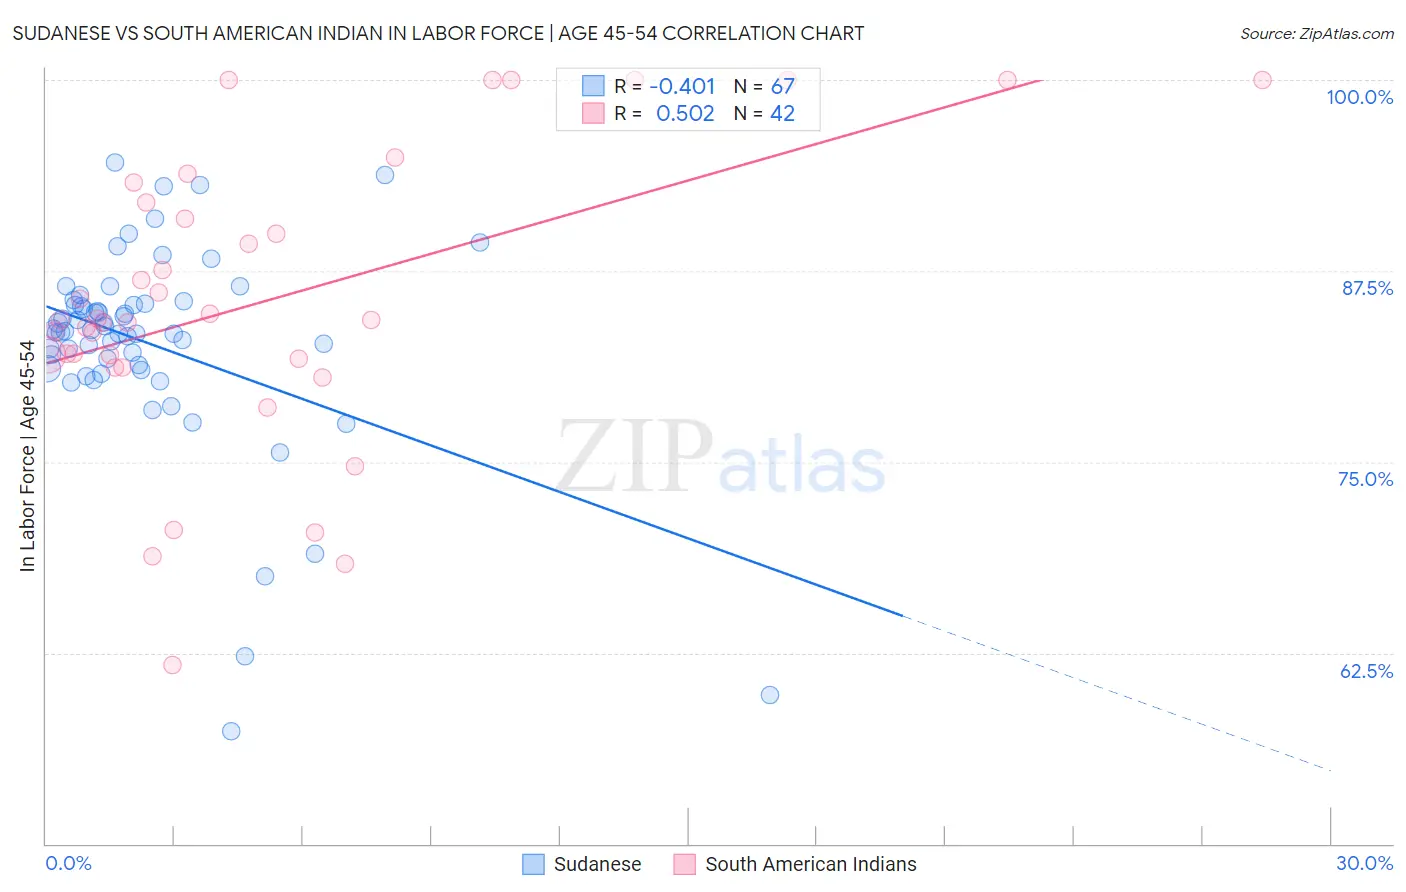
Sudanese vs South American Indian In Labor Force | Age 45-54 Correlation Chart
The statistical analysis conducted on geographies consisting of 110,102,060 people shows a moderate negative correlation between the proportion of Sudanese and labor force participation rate among population between the ages 45 and 54 in the United States with a correlation coefficient (R) of -0.401 and weighted average of 83.0%. Similarly, the statistical analysis conducted on geographies consisting of 164,535,706 people shows a substantial positive correlation between the proportion of South American Indians and labor force participation rate among population between the ages 45 and 54 in the United States with a correlation coefficient (R) of 0.502 and weighted average of 82.9%, a difference of 0.22%.
In Labor Force | Age 45-54 Correlation Summary
| Measurement | Sudanese | South American Indian |
| Minimum | 57.4% | 61.7% |
| Maximum | 94.6% | 100.0% |
| Range | 37.2% | 38.3% |
| Mean | 82.7% | 85.5% |
| Median | 83.6% | 84.3% |
| Interquartile 25% (IQ1) | 81.1% | 81.7% |
| Interquartile 75% (IQ3) | 85.4% | 91.9% |
| Interquartile Range (IQR) | 4.2% | 10.2% |
| Standard Deviation (Sample) | 6.8% | 9.5% |
| Standard Deviation (Population) | 6.8% | 9.4% |
Similar Demographics by In Labor Force | Age 45-54
Demographics Similar to Sudanese by In Labor Force | Age 45-54
In terms of in labor force | age 45-54, the demographic groups most similar to Sudanese are Immigrants from Ukraine (83.0%, a difference of 0.010%), Liberian (83.0%, a difference of 0.010%), Austrian (83.0%, a difference of 0.010%), Immigrants from Kazakhstan (83.0%, a difference of 0.010%), and Finnish (83.1%, a difference of 0.020%).
| Demographics | Rating | Rank | In Labor Force | Age 45-54 |
| Immigrants | Jordan | 85.2 /100 | #127 | Excellent 83.1% |
| Germans | 85.1 /100 | #128 | Excellent 83.1% |
| Immigrants | Northern Europe | 85.1 /100 | #129 | Excellent 83.1% |
| Immigrants | Israel | 84.7 /100 | #130 | Excellent 83.1% |
| Finns | 83.3 /100 | #131 | Excellent 83.1% |
| Immigrants | Ukraine | 82.9 /100 | #132 | Excellent 83.0% |
| Liberians | 82.7 /100 | #133 | Excellent 83.0% |
| Sudanese | 82.0 /100 | #134 | Excellent 83.0% |
| Austrians | 81.3 /100 | #135 | Excellent 83.0% |
| Immigrants | Kazakhstan | 81.0 /100 | #136 | Excellent 83.0% |
| Immigrants | Spain | 80.4 /100 | #137 | Excellent 83.0% |
| Ghanaians | 79.5 /100 | #138 | Good 83.0% |
| Scandinavians | 78.5 /100 | #139 | Good 83.0% |
| Yugoslavians | 78.3 /100 | #140 | Good 83.0% |
| Immigrants | Haiti | 77.9 /100 | #141 | Good 83.0% |
Demographics Similar to South American Indians by In Labor Force | Age 45-54
In terms of in labor force | age 45-54, the demographic groups most similar to South American Indians are Haitian (82.8%, a difference of 0.0%), Dutch (82.8%, a difference of 0.0%), Laotian (82.9%, a difference of 0.010%), German Russian (82.8%, a difference of 0.010%), and Immigrants from Austria (82.9%, a difference of 0.020%).
| Demographics | Rating | Rank | In Labor Force | Age 45-54 |
| Immigrants | Ghana | 70.3 /100 | #154 | Good 82.9% |
| Immigrants | Philippines | 69.0 /100 | #155 | Good 82.9% |
| Immigrants | Saudi Arabia | 68.8 /100 | #156 | Good 82.9% |
| Immigrants | Australia | 68.2 /100 | #157 | Good 82.9% |
| Immigrants | Southern Europe | 67.8 /100 | #158 | Good 82.9% |
| Immigrants | Austria | 64.6 /100 | #159 | Good 82.9% |
| Laotians | 62.8 /100 | #160 | Good 82.9% |
| South American Indians | 62.2 /100 | #161 | Good 82.9% |
| Haitians | 61.8 /100 | #162 | Good 82.8% |
| Dutch | 61.7 /100 | #163 | Good 82.8% |
| German Russians | 61.3 /100 | #164 | Good 82.8% |
| Immigrants | Sudan | 59.9 /100 | #165 | Average 82.8% |
| Immigrants | South Eastern Asia | 57.4 /100 | #166 | Average 82.8% |
| Swiss | 56.5 /100 | #167 | Average 82.8% |
| Immigrants | South Africa | 55.8 /100 | #168 | Average 82.8% |