Salvadoran vs Immigrants from South Eastern Asia Per Capita Income
COMPARE
Salvadoran
Immigrants from South Eastern Asia
Per Capita Income
Per Capita Income Comparison
Salvadorans
Immigrants from South Eastern Asia
$38,858
PER CAPITA INCOME
0.5/ 100
METRIC RATING
266th/ 347
METRIC RANK
$43,539
PER CAPITA INCOME
46.6/ 100
METRIC RATING
176th/ 347
METRIC RANK
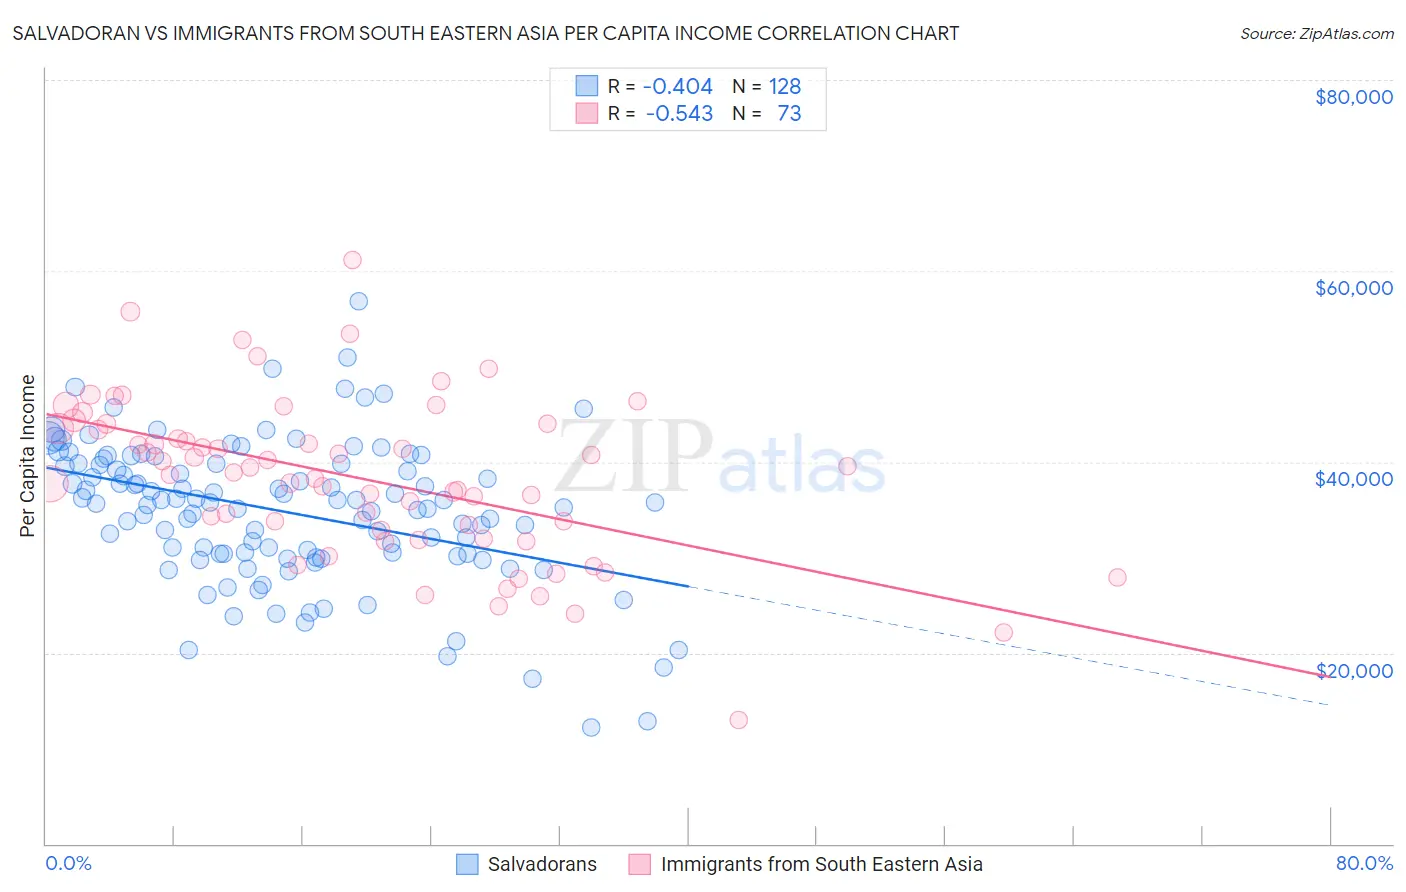
Salvadoran vs Immigrants from South Eastern Asia Per Capita Income Correlation Chart
The statistical analysis conducted on geographies consisting of 399,090,197 people shows a moderate negative correlation between the proportion of Salvadorans and per capita income in the United States with a correlation coefficient (R) of -0.404 and weighted average of $38,858. Similarly, the statistical analysis conducted on geographies consisting of 512,740,931 people shows a substantial negative correlation between the proportion of Immigrants from South Eastern Asia and per capita income in the United States with a correlation coefficient (R) of -0.543 and weighted average of $43,539, a difference of 12.0%.
Per Capita Income Correlation Summary
| Measurement | Salvadoran | Immigrants from South Eastern Asia |
| Minimum | $12,183 | $12,941 |
| Maximum | $56,804 | $61,192 |
| Range | $44,621 | $48,251 |
| Mean | $34,754 | $38,281 |
| Median | $35,664 | $38,844 |
| Interquartile 25% (IQ1) | $30,375 | $32,392 |
| Interquartile 75% (IQ3) | $39,784 | $43,736 |
| Interquartile Range (IQR) | $9,409 | $11,344 |
| Standard Deviation (Sample) | $7,521 | $8,472 |
| Standard Deviation (Population) | $7,492 | $8,414 |
Similar Demographics by Per Capita Income
Demographics Similar to Salvadorans by Per Capita Income
In terms of per capita income, the demographic groups most similar to Salvadorans are Immigrants from Zaire ($38,848, a difference of 0.030%), Liberian ($38,780, a difference of 0.20%), Immigrants from Jamaica ($38,766, a difference of 0.24%), Spanish American ($39,012, a difference of 0.40%), and American ($39,039, a difference of 0.47%).
| Demographics | Rating | Rank | Per Capita Income |
| Malaysians | 0.7 /100 | #259 | Tragic $39,194 |
| Alaskan Athabascans | 0.6 /100 | #260 | Tragic $39,163 |
| Marshallese | 0.6 /100 | #261 | Tragic $39,108 |
| Iroquois | 0.6 /100 | #262 | Tragic $39,104 |
| Belizeans | 0.6 /100 | #263 | Tragic $39,097 |
| Americans | 0.6 /100 | #264 | Tragic $39,039 |
| Spanish Americans | 0.5 /100 | #265 | Tragic $39,012 |
| Salvadorans | 0.5 /100 | #266 | Tragic $38,858 |
| Immigrants | Zaire | 0.4 /100 | #267 | Tragic $38,848 |
| Liberians | 0.4 /100 | #268 | Tragic $38,780 |
| Immigrants | Jamaica | 0.4 /100 | #269 | Tragic $38,766 |
| Immigrants | Belize | 0.3 /100 | #270 | Tragic $38,614 |
| Central Americans | 0.3 /100 | #271 | Tragic $38,560 |
| Immigrants | Cabo Verde | 0.3 /100 | #272 | Tragic $38,540 |
| Nepalese | 0.3 /100 | #273 | Tragic $38,442 |
Demographics Similar to Immigrants from South Eastern Asia by Per Capita Income
In terms of per capita income, the demographic groups most similar to Immigrants from South Eastern Asia are Tlingit-Haida ($43,516, a difference of 0.050%), Immigrants from Costa Rica ($43,464, a difference of 0.17%), Finnish ($43,461, a difference of 0.18%), Celtic ($43,621, a difference of 0.19%), and Colombian ($43,661, a difference of 0.28%).
| Demographics | Rating | Rank | Per Capita Income |
| Immigrants | Peru | 55.3 /100 | #169 | Average $43,852 |
| Scandinavians | 55.2 /100 | #170 | Average $43,848 |
| Immigrants | Eastern Africa | 54.9 /100 | #171 | Average $43,838 |
| Czechoslovakians | 54.1 /100 | #172 | Average $43,806 |
| French | 50.7 /100 | #173 | Average $43,685 |
| Colombians | 50.0 /100 | #174 | Average $43,661 |
| Celtics | 48.9 /100 | #175 | Average $43,621 |
| Immigrants | South Eastern Asia | 46.6 /100 | #176 | Average $43,539 |
| Tlingit-Haida | 45.9 /100 | #177 | Average $43,516 |
| Immigrants | Costa Rica | 44.5 /100 | #178 | Average $43,464 |
| Finns | 44.4 /100 | #179 | Average $43,461 |
| Sierra Leoneans | 42.9 /100 | #180 | Average $43,405 |
| Welsh | 38.2 /100 | #181 | Fair $43,233 |
| Immigrants | Vietnam | 38.1 /100 | #182 | Fair $43,229 |
| Germans | 33.9 /100 | #183 | Fair $43,067 |