Delaware vs Immigrants from Guyana Per Capita Income
COMPARE
Delaware
Immigrants from Guyana
Per Capita Income
Per Capita Income Comparison
Delaware
Immigrants from Guyana
$40,778
PER CAPITA INCOME
3.8/ 100
METRIC RATING
233rd/ 347
METRIC RANK
$40,742
PER CAPITA INCOME
3.6/ 100
METRIC RATING
235th/ 347
METRIC RANK
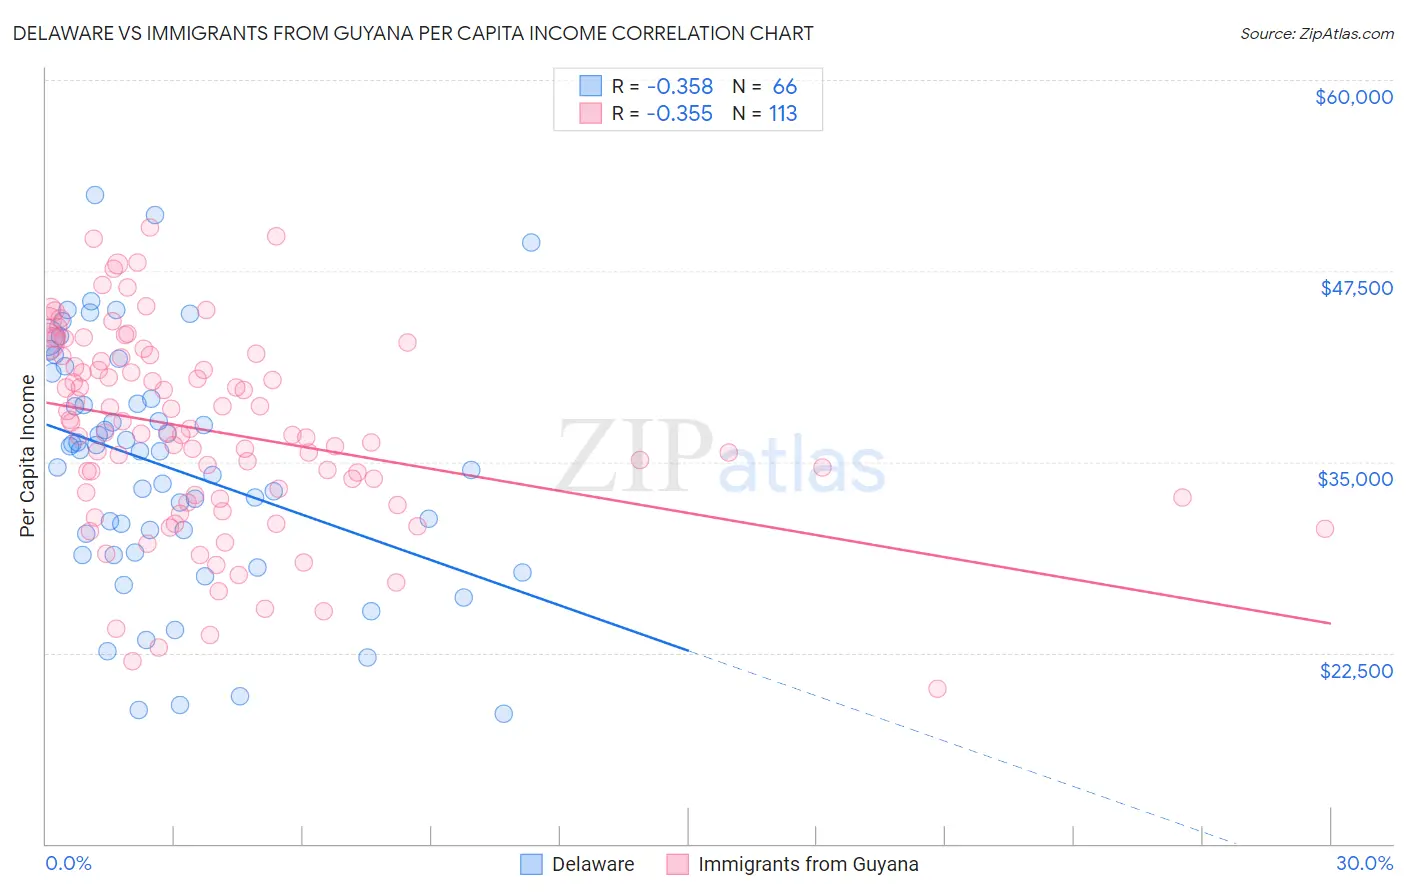
Delaware vs Immigrants from Guyana Per Capita Income Correlation Chart
The statistical analysis conducted on geographies consisting of 96,239,490 people shows a mild negative correlation between the proportion of Delaware and per capita income in the United States with a correlation coefficient (R) of -0.358 and weighted average of $40,778. Similarly, the statistical analysis conducted on geographies consisting of 183,742,461 people shows a mild negative correlation between the proportion of Immigrants from Guyana and per capita income in the United States with a correlation coefficient (R) of -0.355 and weighted average of $40,742, a difference of 0.090%.
Per Capita Income Correlation Summary
| Measurement | Delaware | Immigrants from Guyana |
| Minimum | $18,507 | $20,131 |
| Maximum | $52,470 | $50,352 |
| Range | $33,963 | $30,221 |
| Mean | $34,628 | $36,982 |
| Median | $35,673 | $36,920 |
| Interquartile 25% (IQ1) | $29,044 | $32,654 |
| Interquartile 75% (IQ3) | $39,167 | $41,898 |
| Interquartile Range (IQR) | $10,124 | $9,245 |
| Standard Deviation (Sample) | $7,889 | $6,465 |
| Standard Deviation (Population) | $7,829 | $6,436 |
Demographics Similar to Delaware and Immigrants from Guyana by Per Capita Income
In terms of per capita income, the demographic groups most similar to Delaware are Immigrants from West Indies ($40,763, a difference of 0.040%), Nonimmigrants ($40,669, a difference of 0.27%), Guyanese ($40,949, a difference of 0.42%), Senegalese ($41,000, a difference of 0.55%), and Native Hawaiian ($41,017, a difference of 0.58%). Similarly, the demographic groups most similar to Immigrants from Guyana are Immigrants from West Indies ($40,763, a difference of 0.050%), Nonimmigrants ($40,669, a difference of 0.18%), Guyanese ($40,949, a difference of 0.51%), Senegalese ($41,000, a difference of 0.63%), and Native Hawaiian ($41,017, a difference of 0.67%).
| Demographics | Rating | Rank | Per Capita Income |
| Immigrants | St. Vincent and the Grenadines | 6.4 /100 | #224 | Tragic $41,270 |
| West Indians | 6.0 /100 | #225 | Tragic $41,217 |
| Immigrants | Ecuador | 5.9 /100 | #226 | Tragic $41,195 |
| Immigrants | Ghana | 5.5 /100 | #227 | Tragic $41,131 |
| Immigrants | Grenada | 5.5 /100 | #228 | Tragic $41,123 |
| Nigerians | 4.9 /100 | #229 | Tragic $41,026 |
| Native Hawaiians | 4.9 /100 | #230 | Tragic $41,017 |
| Senegalese | 4.8 /100 | #231 | Tragic $41,000 |
| Guyanese | 4.5 /100 | #232 | Tragic $40,949 |
| Delaware | 3.8 /100 | #233 | Tragic $40,778 |
| Immigrants | West Indies | 3.7 /100 | #234 | Tragic $40,763 |
| Immigrants | Guyana | 3.6 /100 | #235 | Tragic $40,742 |
| Immigrants | Nonimmigrants | 3.4 /100 | #236 | Tragic $40,669 |
| Immigrants | Cambodia | 2.6 /100 | #237 | Tragic $40,434 |
| Somalis | 2.4 /100 | #238 | Tragic $40,367 |
| Tsimshian | 2.4 /100 | #239 | Tragic $40,344 |
| Immigrants | Nigeria | 2.3 /100 | #240 | Tragic $40,339 |
| British West Indians | 2.3 /100 | #241 | Tragic $40,330 |
| Immigrants | Western Africa | 2.2 /100 | #242 | Tragic $40,294 |
| German Russians | 2.2 /100 | #243 | Tragic $40,266 |
| French American Indians | 2.1 /100 | #244 | Tragic $40,244 |