Arapaho vs Immigrants from Guatemala Median Household Income
COMPARE
Arapaho
Immigrants from Guatemala
Median Household Income
Median Household Income Comparison
Arapaho
Immigrants from Guatemala
$67,965
MEDIAN HOUSEHOLD INCOME
0.0/ 100
METRIC RATING
330th/ 347
METRIC RANK
$75,123
MEDIAN HOUSEHOLD INCOME
0.2/ 100
METRIC RATING
279th/ 347
METRIC RANK
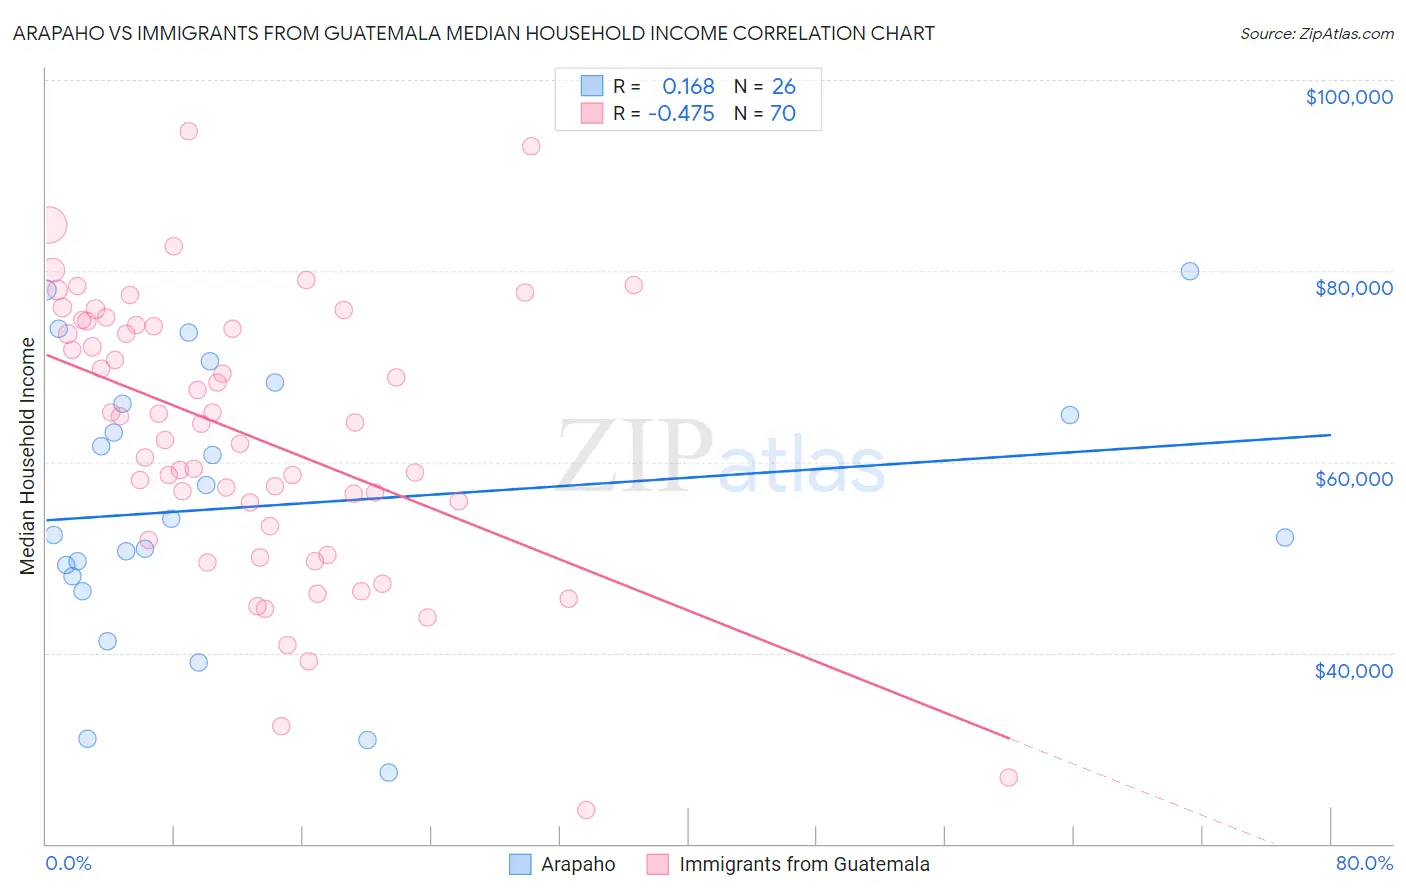
Arapaho vs Immigrants from Guatemala Median Household Income Correlation Chart
The statistical analysis conducted on geographies consisting of 29,777,139 people shows a poor positive correlation between the proportion of Arapaho and median household income in the United States with a correlation coefficient (R) of 0.168 and weighted average of $67,965. Similarly, the statistical analysis conducted on geographies consisting of 377,100,109 people shows a moderate negative correlation between the proportion of Immigrants from Guatemala and median household income in the United States with a correlation coefficient (R) of -0.475 and weighted average of $75,123, a difference of 10.5%.
Median Household Income Correlation Summary
| Measurement | Arapaho | Immigrants from Guatemala |
| Minimum | $27,500 | $23,564 |
| Maximum | $80,000 | $94,609 |
| Range | $52,500 | $71,045 |
| Mean | $55,430 | $62,757 |
| Median | $53,182 | $64,030 |
| Interquartile 25% (IQ1) | $47,998 | $53,313 |
| Interquartile 75% (IQ3) | $66,111 | $74,300 |
| Interquartile Range (IQR) | $18,113 | $20,987 |
| Standard Deviation (Sample) | $14,479 | $14,592 |
| Standard Deviation (Population) | $14,198 | $14,488 |
Similar Demographics by Median Household Income
Demographics Similar to Arapaho by Median Household Income
In terms of median household income, the demographic groups most similar to Arapaho are Native/Alaskan ($67,879, a difference of 0.13%), Sioux ($67,792, a difference of 0.25%), Creek ($67,715, a difference of 0.37%), Black/African American ($67,573, a difference of 0.58%), and Dutch West Indian ($68,412, a difference of 0.66%).
| Demographics | Rating | Rank | Median Household Income |
| Bahamians | 0.0 /100 | #323 | Tragic $69,726 |
| Yup'ik | 0.0 /100 | #324 | Tragic $69,695 |
| Seminole | 0.0 /100 | #325 | Tragic $69,420 |
| Yuman | 0.0 /100 | #326 | Tragic $68,743 |
| Immigrants | Cuba | 0.0 /100 | #327 | Tragic $68,461 |
| Menominee | 0.0 /100 | #328 | Tragic $68,423 |
| Dutch West Indians | 0.0 /100 | #329 | Tragic $68,412 |
| Arapaho | 0.0 /100 | #330 | Tragic $67,965 |
| Natives/Alaskans | 0.0 /100 | #331 | Tragic $67,879 |
| Sioux | 0.0 /100 | #332 | Tragic $67,792 |
| Creek | 0.0 /100 | #333 | Tragic $67,715 |
| Blacks/African Americans | 0.0 /100 | #334 | Tragic $67,573 |
| Cheyenne | 0.0 /100 | #335 | Tragic $66,974 |
| Immigrants | Congo | 0.0 /100 | #336 | Tragic $66,768 |
| Kiowa | 0.0 /100 | #337 | Tragic $65,914 |
Demographics Similar to Immigrants from Guatemala by Median Household Income
In terms of median household income, the demographic groups most similar to Immigrants from Guatemala are Osage ($75,240, a difference of 0.16%), Senegalese ($74,999, a difference of 0.16%), Immigrants from Liberia ($74,896, a difference of 0.30%), Spanish American ($75,386, a difference of 0.35%), and Central American Indian ($74,847, a difference of 0.37%).
| Demographics | Rating | Rank | Median Household Income |
| Somalis | 0.3 /100 | #272 | Tragic $75,782 |
| Liberians | 0.2 /100 | #273 | Tragic $75,667 |
| British West Indians | 0.2 /100 | #274 | Tragic $75,647 |
| Immigrants | Micronesia | 0.2 /100 | #275 | Tragic $75,574 |
| Immigrants | Latin America | 0.2 /100 | #276 | Tragic $75,420 |
| Spanish Americans | 0.2 /100 | #277 | Tragic $75,386 |
| Osage | 0.2 /100 | #278 | Tragic $75,240 |
| Immigrants | Guatemala | 0.2 /100 | #279 | Tragic $75,123 |
| Senegalese | 0.2 /100 | #280 | Tragic $74,999 |
| Immigrants | Liberia | 0.1 /100 | #281 | Tragic $74,896 |
| Central American Indians | 0.1 /100 | #282 | Tragic $74,847 |
| Cree | 0.1 /100 | #283 | Tragic $74,685 |
| Yaqui | 0.1 /100 | #284 | Tragic $74,596 |
| Mexicans | 0.1 /100 | #285 | Tragic $74,399 |
| Immigrants | Somalia | 0.1 /100 | #286 | Tragic $74,300 |