Belgian vs Belizean Median Earnings
COMPARE
Belgian
Belizean
Median Earnings
Median Earnings Comparison
Belgians
Belizeans
$46,375
MEDIAN EARNINGS
48.0/ 100
METRIC RATING
177th/ 347
METRIC RANK
$42,702
MEDIAN EARNINGS
0.5/ 100
METRIC RATING
269th/ 347
METRIC RANK
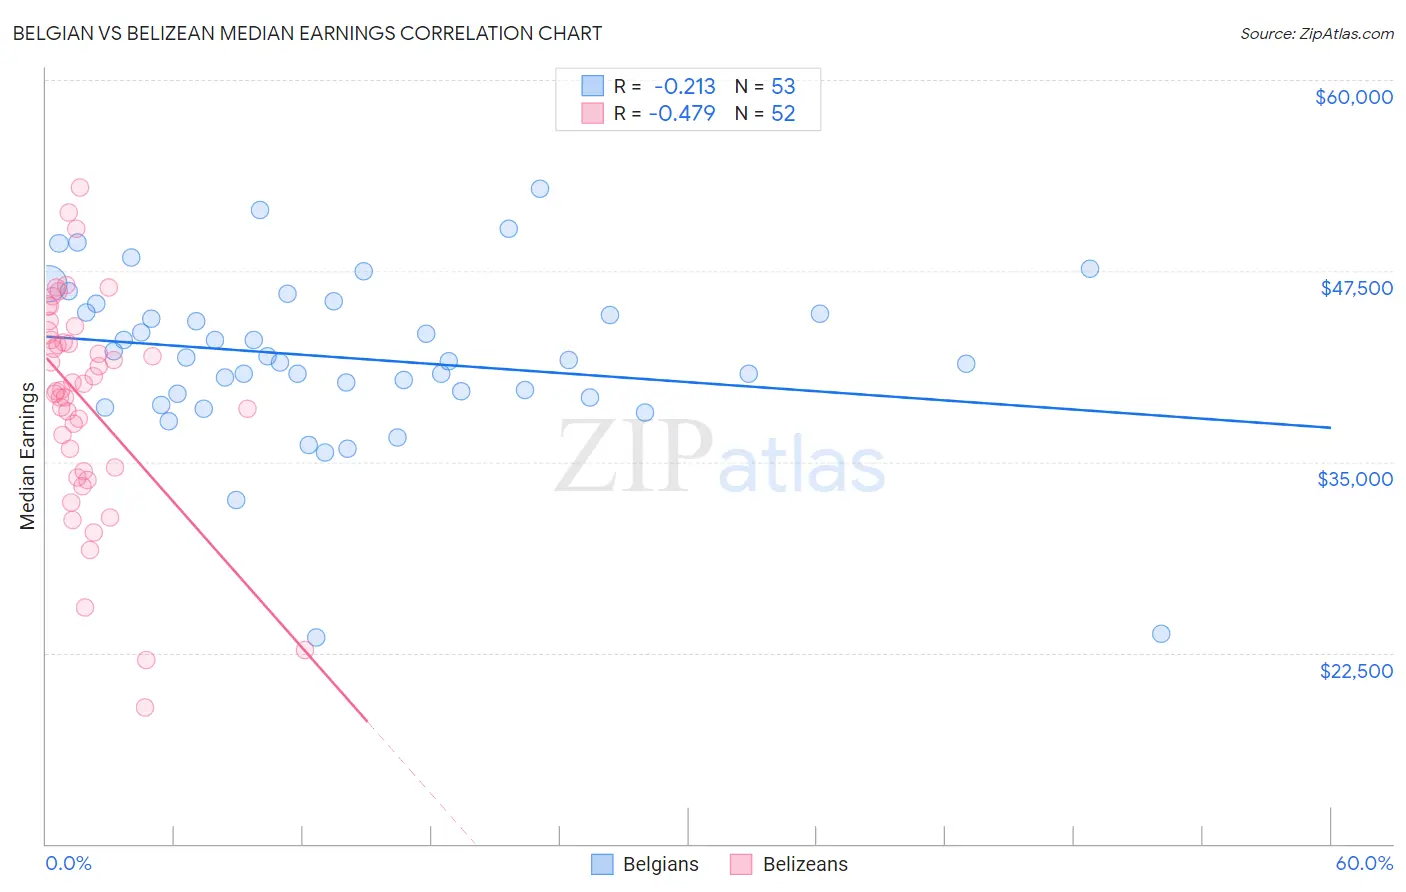
Belgian vs Belizean Median Earnings Correlation Chart
The statistical analysis conducted on geographies consisting of 356,004,504 people shows a weak negative correlation between the proportion of Belgians and median earnings in the United States with a correlation coefficient (R) of -0.213 and weighted average of $46,375. Similarly, the statistical analysis conducted on geographies consisting of 144,215,704 people shows a moderate negative correlation between the proportion of Belizeans and median earnings in the United States with a correlation coefficient (R) of -0.479 and weighted average of $42,702, a difference of 8.6%.
Median Earnings Correlation Summary
| Measurement | Belgian | Belizean |
| Minimum | $23,500 | $18,932 |
| Maximum | $52,848 | $52,967 |
| Range | $29,348 | $34,035 |
| Mean | $41,793 | $38,949 |
| Median | $41,635 | $39,910 |
| Interquartile 25% (IQ1) | $39,329 | $34,513 |
| Interquartile 75% (IQ3) | $45,075 | $43,245 |
| Interquartile Range (IQR) | $5,747 | $8,732 |
| Standard Deviation (Sample) | $5,579 | $7,165 |
| Standard Deviation (Population) | $5,526 | $7,096 |
Similar Demographics by Median Earnings
Demographics Similar to Belgians by Median Earnings
In terms of median earnings, the demographic groups most similar to Belgians are Danish ($46,392, a difference of 0.040%), Basque ($46,399, a difference of 0.050%), Colombian ($46,349, a difference of 0.060%), English ($46,334, a difference of 0.090%), and Puget Sound Salish ($46,333, a difference of 0.090%).
| Demographics | Rating | Rank | Median Earnings |
| Immigrants | Immigrants | 51.6 /100 | #170 | Average $46,478 |
| Scottish | 51.1 /100 | #171 | Average $46,463 |
| Kenyans | 51.0 /100 | #172 | Average $46,462 |
| Ghanaians | 50.3 /100 | #173 | Average $46,440 |
| Scandinavians | 50.0 /100 | #174 | Average $46,433 |
| Basques | 48.8 /100 | #175 | Average $46,399 |
| Danes | 48.6 /100 | #176 | Average $46,392 |
| Belgians | 48.0 /100 | #177 | Average $46,375 |
| Colombians | 47.1 /100 | #178 | Average $46,349 |
| English | 46.5 /100 | #179 | Average $46,334 |
| Puget Sound Salish | 46.5 /100 | #180 | Average $46,333 |
| Immigrants | Cameroon | 46.4 /100 | #181 | Average $46,329 |
| Swiss | 45.9 /100 | #182 | Average $46,315 |
| French | 45.2 /100 | #183 | Average $46,296 |
| Immigrants | Kenya | 42.4 /100 | #184 | Average $46,214 |
Demographics Similar to Belizeans by Median Earnings
In terms of median earnings, the demographic groups most similar to Belizeans are American ($42,742, a difference of 0.090%), Osage ($42,651, a difference of 0.12%), Cree ($42,777, a difference of 0.17%), Pennsylvania German ($42,615, a difference of 0.21%), and Immigrants from Laos ($42,884, a difference of 0.43%).
| Demographics | Rating | Rank | Median Earnings |
| Nicaraguans | 0.8 /100 | #262 | Tragic $43,026 |
| Inupiat | 0.8 /100 | #263 | Tragic $43,000 |
| Immigrants | Liberia | 0.7 /100 | #264 | Tragic $42,923 |
| Salvadorans | 0.7 /100 | #265 | Tragic $42,912 |
| Immigrants | Laos | 0.7 /100 | #266 | Tragic $42,884 |
| Cree | 0.6 /100 | #267 | Tragic $42,777 |
| Americans | 0.6 /100 | #268 | Tragic $42,742 |
| Belizeans | 0.5 /100 | #269 | Tragic $42,702 |
| Osage | 0.5 /100 | #270 | Tragic $42,651 |
| Pennsylvania Germans | 0.5 /100 | #271 | Tragic $42,615 |
| Iroquois | 0.4 /100 | #272 | Tragic $42,430 |
| Immigrants | Dominica | 0.4 /100 | #273 | Tragic $42,420 |
| Immigrants | El Salvador | 0.4 /100 | #274 | Tragic $42,413 |
| Immigrants | Belize | 0.3 /100 | #275 | Tragic $42,339 |
| Spanish Americans | 0.3 /100 | #276 | Tragic $42,316 |