Alaska Native vs Belizean Median Earnings
COMPARE
Alaska Native
Belizean
Median Earnings
Median Earnings Comparison
Alaska Natives
Belizeans
$43,750
MEDIAN EARNINGS
2.3/ 100
METRIC RATING
250th/ 347
METRIC RANK
$42,702
MEDIAN EARNINGS
0.5/ 100
METRIC RATING
269th/ 347
METRIC RANK
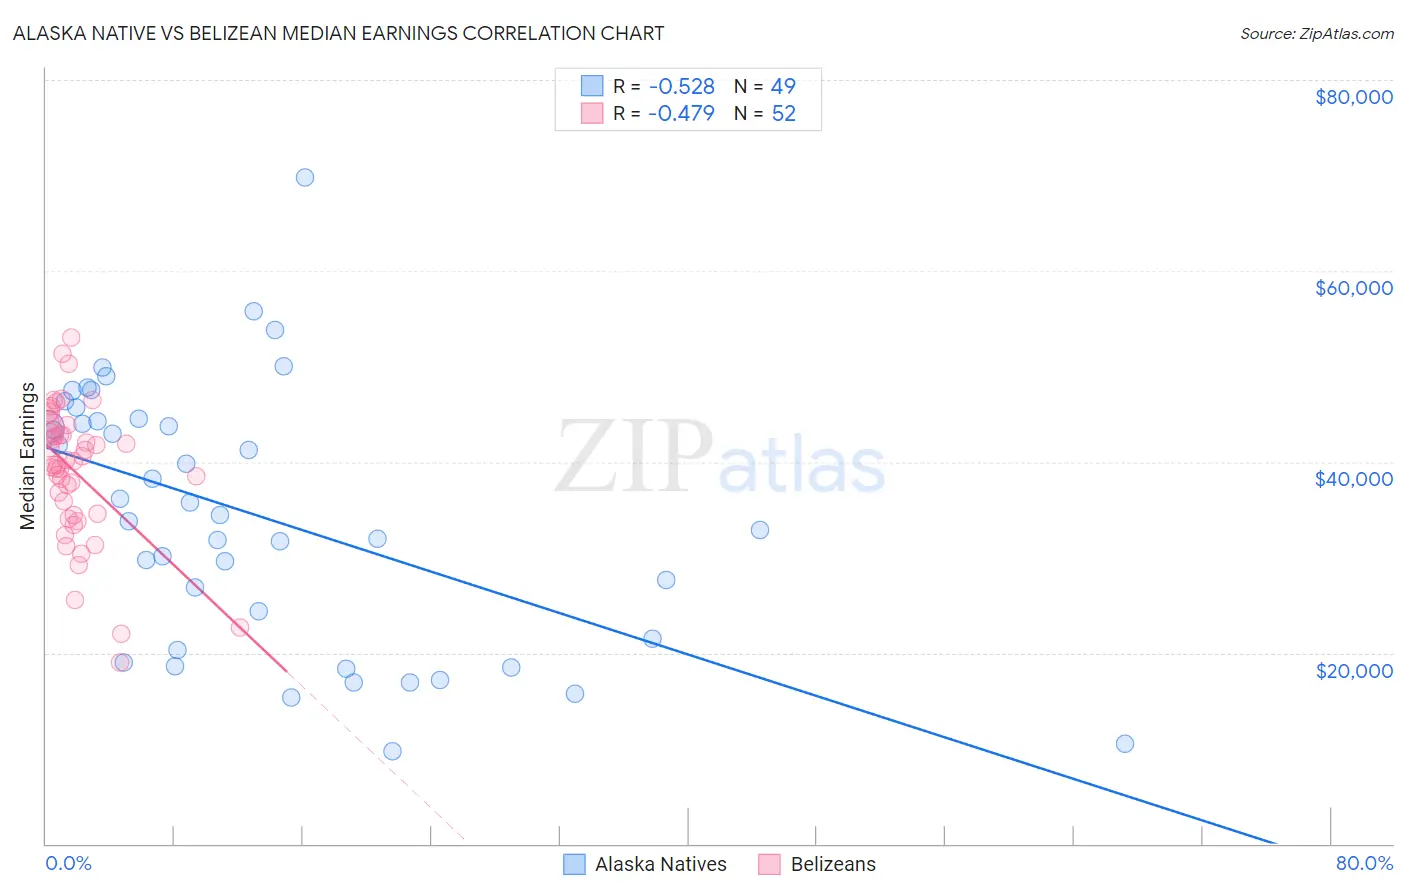
Alaska Native vs Belizean Median Earnings Correlation Chart
The statistical analysis conducted on geographies consisting of 76,766,332 people shows a substantial negative correlation between the proportion of Alaska Natives and median earnings in the United States with a correlation coefficient (R) of -0.528 and weighted average of $43,750. Similarly, the statistical analysis conducted on geographies consisting of 144,215,704 people shows a moderate negative correlation between the proportion of Belizeans and median earnings in the United States with a correlation coefficient (R) of -0.479 and weighted average of $42,702, a difference of 2.5%.
Median Earnings Correlation Summary
| Measurement | Alaska Native | Belizean |
| Minimum | $9,662 | $18,932 |
| Maximum | $69,808 | $52,967 |
| Range | $60,146 | $34,035 |
| Mean | $34,396 | $38,949 |
| Median | $34,412 | $39,910 |
| Interquartile 25% (IQ1) | $20,906 | $34,513 |
| Interquartile 75% (IQ3) | $44,339 | $43,245 |
| Interquartile Range (IQR) | $23,432 | $8,732 |
| Standard Deviation (Sample) | $13,540 | $7,165 |
| Standard Deviation (Population) | $13,401 | $7,096 |
Demographics Similar to Alaska Natives and Belizeans by Median Earnings
In terms of median earnings, the demographic groups most similar to Alaska Natives are Tsimshian ($43,695, a difference of 0.13%), Hawaiian ($43,673, a difference of 0.18%), Malaysian ($43,844, a difference of 0.22%), Somali ($43,567, a difference of 0.42%), and Liberian ($43,536, a difference of 0.49%). Similarly, the demographic groups most similar to Belizeans are American ($42,742, a difference of 0.090%), Cree ($42,777, a difference of 0.17%), Immigrants from Laos ($42,884, a difference of 0.43%), Salvadoran ($42,912, a difference of 0.49%), and Immigrants from Liberia ($42,923, a difference of 0.52%).
| Demographics | Rating | Rank | Median Earnings |
| Malaysians | 2.6 /100 | #249 | Tragic $43,844 |
| Alaska Natives | 2.3 /100 | #250 | Tragic $43,750 |
| Tsimshian | 2.1 /100 | #251 | Tragic $43,695 |
| Hawaiians | 2.0 /100 | #252 | Tragic $43,673 |
| Somalis | 1.8 /100 | #253 | Tragic $43,567 |
| Liberians | 1.7 /100 | #254 | Tragic $43,536 |
| Immigrants | Middle Africa | 1.4 /100 | #255 | Tragic $43,416 |
| Alaskan Athabascans | 1.4 /100 | #256 | Tragic $43,393 |
| Jamaicans | 1.3 /100 | #257 | Tragic $43,343 |
| French American Indians | 1.3 /100 | #258 | Tragic $43,333 |
| German Russians | 1.1 /100 | #259 | Tragic $43,200 |
| Immigrants | Somalia | 0.9 /100 | #260 | Tragic $43,100 |
| Immigrants | Jamaica | 0.8 /100 | #261 | Tragic $43,026 |
| Nicaraguans | 0.8 /100 | #262 | Tragic $43,026 |
| Inupiat | 0.8 /100 | #263 | Tragic $43,000 |
| Immigrants | Liberia | 0.7 /100 | #264 | Tragic $42,923 |
| Salvadorans | 0.7 /100 | #265 | Tragic $42,912 |
| Immigrants | Laos | 0.7 /100 | #266 | Tragic $42,884 |
| Cree | 0.6 /100 | #267 | Tragic $42,777 |
| Americans | 0.6 /100 | #268 | Tragic $42,742 |
| Belizeans | 0.5 /100 | #269 | Tragic $42,702 |