Nicaraguan vs Belizean Median Earnings
COMPARE
Nicaraguan
Belizean
Median Earnings
Median Earnings Comparison
Nicaraguans
Belizeans
$43,026
MEDIAN EARNINGS
0.8/ 100
METRIC RATING
262nd/ 347
METRIC RANK
$42,702
MEDIAN EARNINGS
0.5/ 100
METRIC RATING
269th/ 347
METRIC RANK
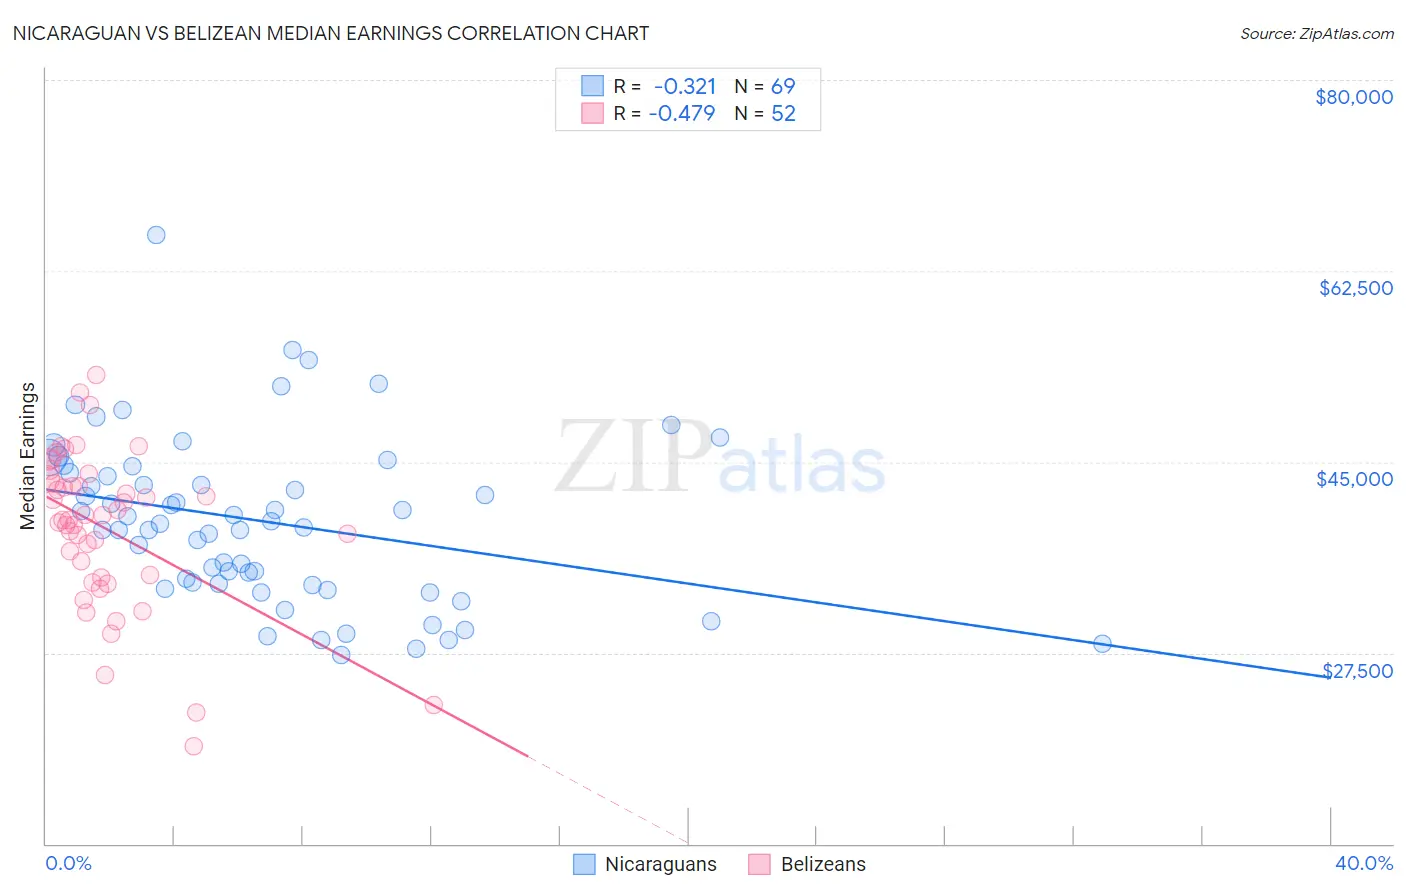
Nicaraguan vs Belizean Median Earnings Correlation Chart
The statistical analysis conducted on geographies consisting of 285,714,618 people shows a mild negative correlation between the proportion of Nicaraguans and median earnings in the United States with a correlation coefficient (R) of -0.321 and weighted average of $43,026. Similarly, the statistical analysis conducted on geographies consisting of 144,215,704 people shows a moderate negative correlation between the proportion of Belizeans and median earnings in the United States with a correlation coefficient (R) of -0.479 and weighted average of $42,702, a difference of 0.76%.
Median Earnings Correlation Summary
| Measurement | Nicaraguan | Belizean |
| Minimum | $27,330 | $18,932 |
| Maximum | $65,764 | $52,967 |
| Range | $38,434 | $34,035 |
| Mean | $39,567 | $38,949 |
| Median | $39,352 | $39,910 |
| Interquartile 25% (IQ1) | $33,795 | $34,513 |
| Interquartile 75% (IQ3) | $44,292 | $43,245 |
| Interquartile Range (IQR) | $10,497 | $8,732 |
| Standard Deviation (Sample) | $7,612 | $7,165 |
| Standard Deviation (Population) | $7,557 | $7,096 |
Demographics Similar to Nicaraguans and Belizeans by Median Earnings
In terms of median earnings, the demographic groups most similar to Nicaraguans are Immigrants from Jamaica ($43,026, a difference of 0.0%), Inupiat ($43,000, a difference of 0.060%), Immigrants from Somalia ($43,100, a difference of 0.17%), Immigrants from Liberia ($42,923, a difference of 0.24%), and Salvadoran ($42,912, a difference of 0.27%). Similarly, the demographic groups most similar to Belizeans are American ($42,742, a difference of 0.090%), Osage ($42,651, a difference of 0.12%), Cree ($42,777, a difference of 0.17%), Pennsylvania German ($42,615, a difference of 0.21%), and Immigrants from Laos ($42,884, a difference of 0.43%).
| Demographics | Rating | Rank | Median Earnings |
| Immigrants | Middle Africa | 1.4 /100 | #255 | Tragic $43,416 |
| Alaskan Athabascans | 1.4 /100 | #256 | Tragic $43,393 |
| Jamaicans | 1.3 /100 | #257 | Tragic $43,343 |
| French American Indians | 1.3 /100 | #258 | Tragic $43,333 |
| German Russians | 1.1 /100 | #259 | Tragic $43,200 |
| Immigrants | Somalia | 0.9 /100 | #260 | Tragic $43,100 |
| Immigrants | Jamaica | 0.8 /100 | #261 | Tragic $43,026 |
| Nicaraguans | 0.8 /100 | #262 | Tragic $43,026 |
| Inupiat | 0.8 /100 | #263 | Tragic $43,000 |
| Immigrants | Liberia | 0.7 /100 | #264 | Tragic $42,923 |
| Salvadorans | 0.7 /100 | #265 | Tragic $42,912 |
| Immigrants | Laos | 0.7 /100 | #266 | Tragic $42,884 |
| Cree | 0.6 /100 | #267 | Tragic $42,777 |
| Americans | 0.6 /100 | #268 | Tragic $42,742 |
| Belizeans | 0.5 /100 | #269 | Tragic $42,702 |
| Osage | 0.5 /100 | #270 | Tragic $42,651 |
| Pennsylvania Germans | 0.5 /100 | #271 | Tragic $42,615 |
| Iroquois | 0.4 /100 | #272 | Tragic $42,430 |
| Immigrants | Dominica | 0.4 /100 | #273 | Tragic $42,420 |
| Immigrants | El Salvador | 0.4 /100 | #274 | Tragic $42,413 |
| Immigrants | Belize | 0.3 /100 | #275 | Tragic $42,339 |