Subsaharan African vs Iraqi High School Diploma
COMPARE
Subsaharan African
Iraqi
High School Diploma
High School Diploma Comparison
Sub-Saharan Africans
Iraqis
87.9%
HIGH SCHOOL DIPLOMA
2.8/ 100
METRIC RATING
236th/ 347
METRIC RANK
89.5%
HIGH SCHOOL DIPLOMA
73.9/ 100
METRIC RATING
147th/ 347
METRIC RANK
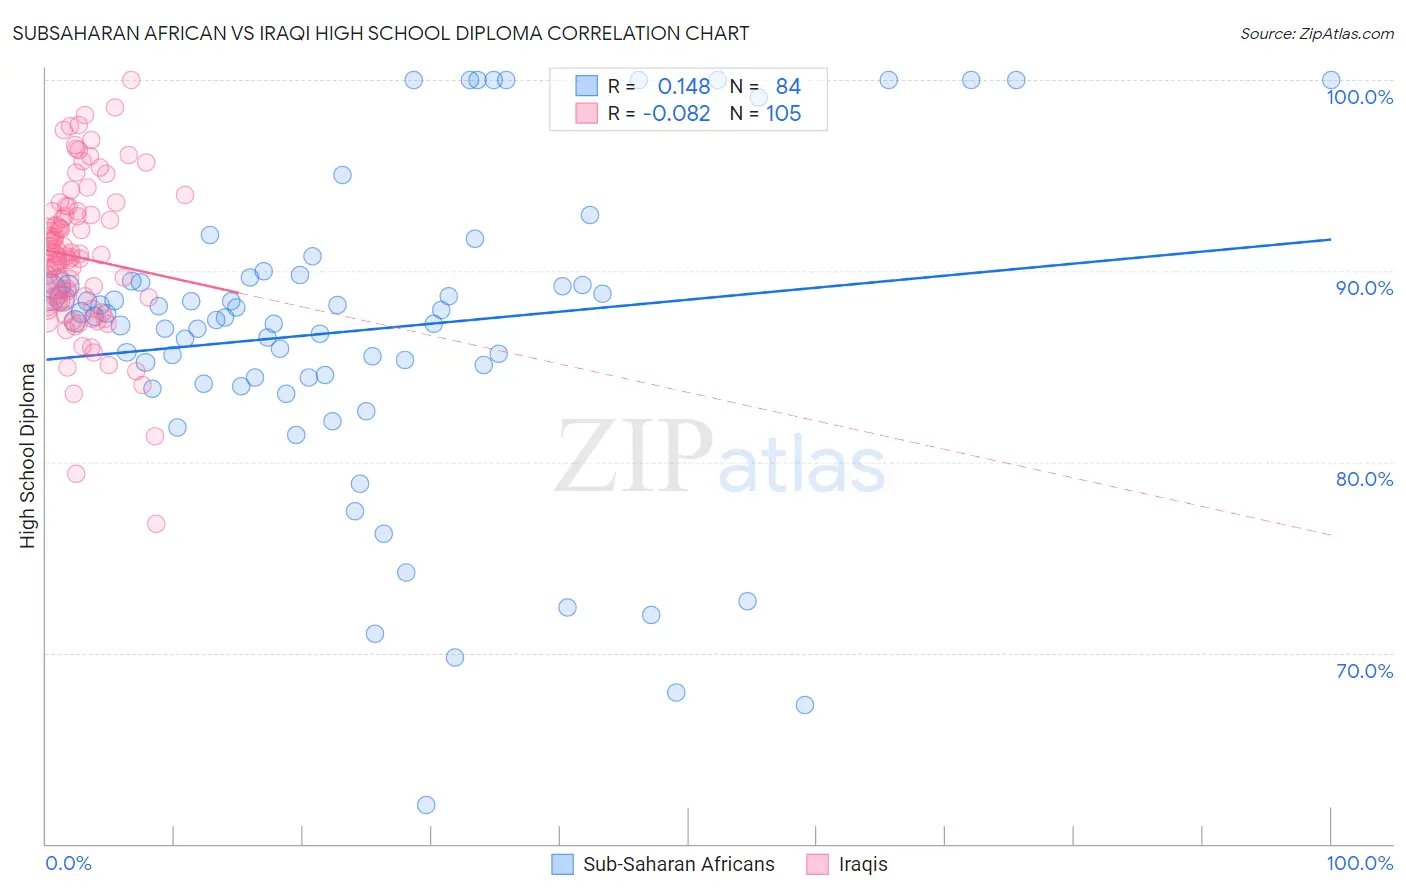
Subsaharan African vs Iraqi High School Diploma Correlation Chart
The statistical analysis conducted on geographies consisting of 508,219,008 people shows a poor positive correlation between the proportion of Sub-Saharan Africans and percentage of population with at least high school diploma education in the United States with a correlation coefficient (R) of 0.148 and weighted average of 87.9%. Similarly, the statistical analysis conducted on geographies consisting of 170,614,457 people shows a slight negative correlation between the proportion of Iraqis and percentage of population with at least high school diploma education in the United States with a correlation coefficient (R) of -0.082 and weighted average of 89.5%, a difference of 1.8%.
High School Diploma Correlation Summary
| Measurement | Subsaharan African | Iraqi |
| Minimum | 62.1% | 76.8% |
| Maximum | 100.0% | 100.0% |
| Range | 37.9% | 23.2% |
| Mean | 86.9% | 90.7% |
| Median | 87.6% | 90.7% |
| Interquartile 25% (IQ1) | 84.4% | 88.4% |
| Interquartile 75% (IQ3) | 89.4% | 93.0% |
| Interquartile Range (IQR) | 5.0% | 4.6% |
| Standard Deviation (Sample) | 8.1% | 4.0% |
| Standard Deviation (Population) | 8.0% | 4.0% |
Similar Demographics by High School Diploma
Demographics Similar to Sub-Saharan Africans by High School Diploma
In terms of high school diploma, the demographic groups most similar to Sub-Saharan Africans are Taiwanese (87.9%, a difference of 0.010%), Sioux (87.9%, a difference of 0.010%), South American (87.9%, a difference of 0.010%), Immigrants from Bahamas (88.0%, a difference of 0.020%), and Immigrants from Panama (88.0%, a difference of 0.040%).
| Demographics | Rating | Rank | High School Diploma |
| Nigerians | 5.2 /100 | #229 | Tragic 88.2% |
| Blackfeet | 4.2 /100 | #230 | Tragic 88.1% |
| Colombians | 3.8 /100 | #231 | Tragic 88.1% |
| Immigrants | Middle Africa | 3.4 /100 | #232 | Tragic 88.0% |
| Immigrants | Panama | 3.1 /100 | #233 | Tragic 88.0% |
| Immigrants | Thailand | 3.1 /100 | #234 | Tragic 88.0% |
| Immigrants | Bahamas | 2.9 /100 | #235 | Tragic 88.0% |
| Sub-Saharan Africans | 2.8 /100 | #236 | Tragic 87.9% |
| Taiwanese | 2.8 /100 | #237 | Tragic 87.9% |
| Sioux | 2.7 /100 | #238 | Tragic 87.9% |
| South Americans | 2.7 /100 | #239 | Tragic 87.9% |
| Comanche | 2.2 /100 | #240 | Tragic 87.9% |
| Immigrants | Uzbekistan | 2.1 /100 | #241 | Tragic 87.8% |
| Cheyenne | 2.1 /100 | #242 | Tragic 87.8% |
| Immigrants | Philippines | 1.9 /100 | #243 | Tragic 87.8% |
Demographics Similar to Iraqis by High School Diploma
In terms of high school diploma, the demographic groups most similar to Iraqis are Immigrants from Lebanon (89.5%, a difference of 0.010%), Immigrants from Poland (89.5%, a difference of 0.020%), Argentinean (89.5%, a difference of 0.030%), Immigrants from Brazil (89.5%, a difference of 0.050%), and Immigrants from Spain (89.5%, a difference of 0.050%).
| Demographics | Rating | Rank | High School Diploma |
| Immigrants | Egypt | 81.2 /100 | #140 | Excellent 89.6% |
| Chileans | 79.0 /100 | #141 | Good 89.6% |
| Indians (Asian) | 78.8 /100 | #142 | Good 89.6% |
| Pakistanis | 78.3 /100 | #143 | Good 89.6% |
| Immigrants | Kenya | 78.0 /100 | #144 | Good 89.6% |
| Immigrants | Brazil | 76.6 /100 | #145 | Good 89.5% |
| Immigrants | Spain | 76.2 /100 | #146 | Good 89.5% |
| Iraqis | 73.9 /100 | #147 | Good 89.5% |
| Immigrants | Lebanon | 73.4 /100 | #148 | Good 89.5% |
| Immigrants | Poland | 72.9 /100 | #149 | Good 89.5% |
| Argentineans | 72.3 /100 | #150 | Good 89.5% |
| Paraguayans | 71.4 /100 | #151 | Good 89.5% |
| Asians | 70.7 /100 | #152 | Good 89.4% |
| Immigrants | Iraq | 68.7 /100 | #153 | Good 89.4% |
| Alsatians | 66.8 /100 | #154 | Good 89.4% |