Subsaharan African vs Cambodian Median Male Earnings
COMPARE
Subsaharan African
Cambodian
Median Male Earnings
Median Male Earnings Comparison
Sub-Saharan Africans
Cambodians
$50,408
MEDIAN MALE EARNINGS
1.8/ 100
METRIC RATING
247th/ 347
METRIC RANK
$62,516
MEDIAN MALE EARNINGS
100.0/ 100
METRIC RATING
44th/ 347
METRIC RANK
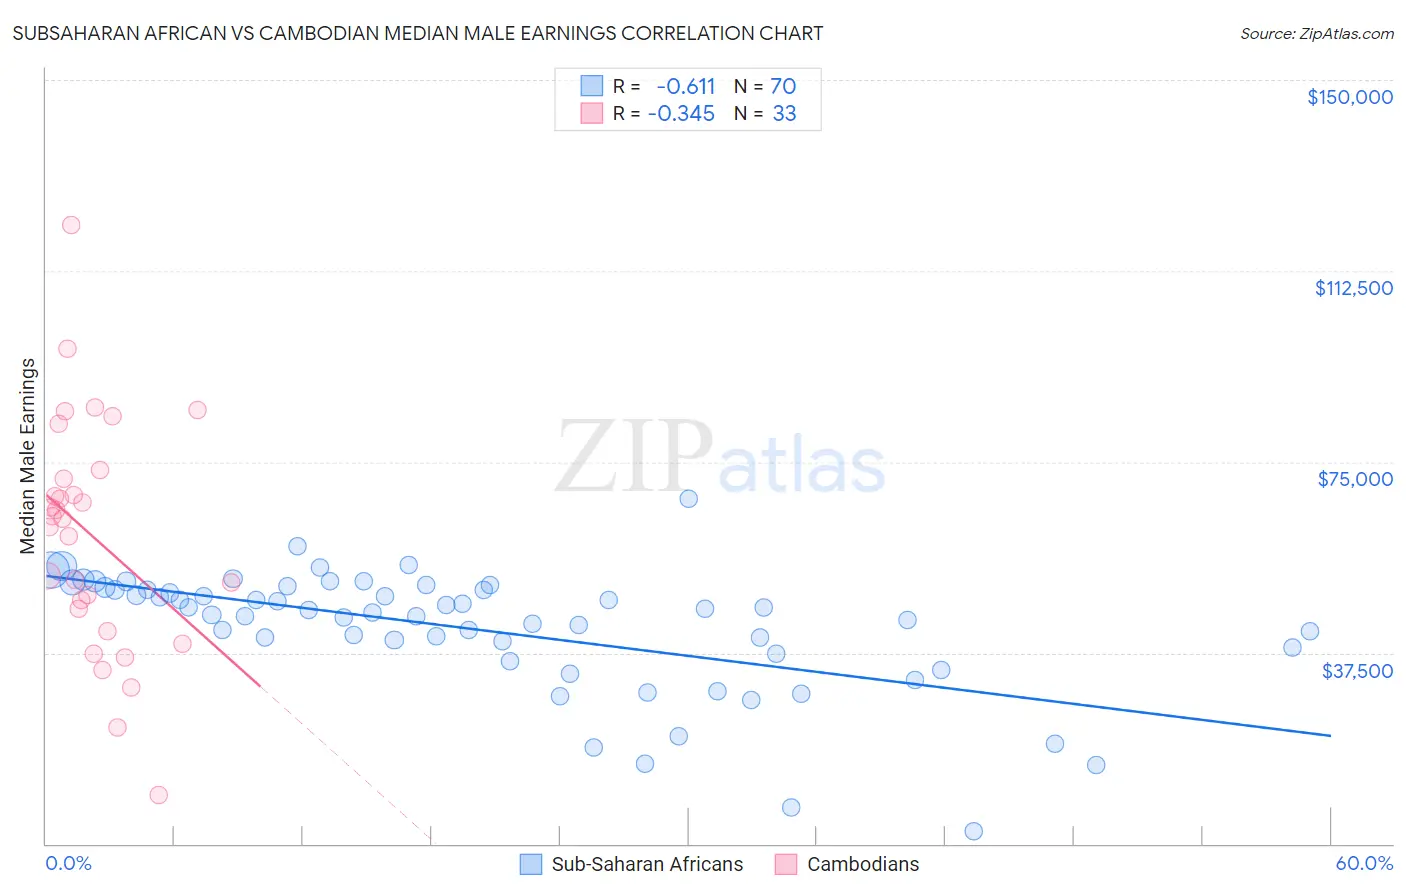
Subsaharan African vs Cambodian Median Male Earnings Correlation Chart
The statistical analysis conducted on geographies consisting of 507,818,984 people shows a significant negative correlation between the proportion of Sub-Saharan Africans and median male earnings in the United States with a correlation coefficient (R) of -0.611 and weighted average of $50,408. Similarly, the statistical analysis conducted on geographies consisting of 102,506,129 people shows a mild negative correlation between the proportion of Cambodians and median male earnings in the United States with a correlation coefficient (R) of -0.345 and weighted average of $62,516, a difference of 24.0%.
Median Male Earnings Correlation Summary
| Measurement | Subsaharan African | Cambodian |
| Minimum | $2,499 | $9,467 |
| Maximum | $67,727 | $121,577 |
| Range | $65,228 | $112,110 |
| Mean | $42,175 | $60,326 |
| Median | $45,761 | $63,742 |
| Interquartile 25% (IQ1) | $38,471 | $43,962 |
| Interquartile 75% (IQ3) | $49,902 | $72,546 |
| Interquartile Range (IQR) | $11,431 | $28,584 |
| Standard Deviation (Sample) | $12,034 | $22,914 |
| Standard Deviation (Population) | $11,948 | $22,564 |
Similar Demographics by Median Male Earnings
Demographics Similar to Sub-Saharan Africans by Median Male Earnings
In terms of median male earnings, the demographic groups most similar to Sub-Saharan Africans are Immigrants from Ecuador ($50,474, a difference of 0.13%), Hawaiian ($50,488, a difference of 0.16%), Immigrants from Guyana ($50,321, a difference of 0.17%), Immigrants from Burma/Myanmar ($50,298, a difference of 0.22%), and Osage ($50,292, a difference of 0.23%).
| Demographics | Rating | Rank | Median Male Earnings |
| West Indians | 2.3 /100 | #240 | Tragic $50,682 |
| Immigrants | St. Vincent and the Grenadines | 2.3 /100 | #241 | Tragic $50,665 |
| Guyanese | 2.2 /100 | #242 | Tragic $50,613 |
| French American Indians | 2.2 /100 | #243 | Tragic $50,611 |
| Houma | 2.0 /100 | #244 | Tragic $50,547 |
| Hawaiians | 1.9 /100 | #245 | Tragic $50,488 |
| Immigrants | Ecuador | 1.9 /100 | #246 | Tragic $50,474 |
| Sub-Saharan Africans | 1.8 /100 | #247 | Tragic $50,408 |
| Immigrants | Guyana | 1.6 /100 | #248 | Tragic $50,321 |
| Immigrants | Burma/Myanmar | 1.6 /100 | #249 | Tragic $50,298 |
| Osage | 1.6 /100 | #250 | Tragic $50,292 |
| Immigrants | Grenada | 1.6 /100 | #251 | Tragic $50,279 |
| Immigrants | Cabo Verde | 1.2 /100 | #252 | Tragic $50,009 |
| German Russians | 1.1 /100 | #253 | Tragic $49,924 |
| Senegalese | 1.0 /100 | #254 | Tragic $49,774 |
Demographics Similar to Cambodians by Median Male Earnings
In terms of median male earnings, the demographic groups most similar to Cambodians are Bulgarian ($62,378, a difference of 0.22%), Immigrants from Belarus ($62,658, a difference of 0.23%), Immigrants from Greece ($62,689, a difference of 0.28%), Immigrants from Turkey ($62,728, a difference of 0.34%), and Immigrants from Czechoslovakia ($62,217, a difference of 0.48%).
| Demographics | Rating | Rank | Median Male Earnings |
| Immigrants | Sri Lanka | 100.0 /100 | #37 | Exceptional $63,099 |
| Maltese | 100.0 /100 | #38 | Exceptional $62,953 |
| Immigrants | South Africa | 100.0 /100 | #39 | Exceptional $62,899 |
| Australians | 100.0 /100 | #40 | Exceptional $62,857 |
| Immigrants | Turkey | 100.0 /100 | #41 | Exceptional $62,728 |
| Immigrants | Greece | 100.0 /100 | #42 | Exceptional $62,689 |
| Immigrants | Belarus | 100.0 /100 | #43 | Exceptional $62,658 |
| Cambodians | 100.0 /100 | #44 | Exceptional $62,516 |
| Bulgarians | 100.0 /100 | #45 | Exceptional $62,378 |
| Immigrants | Czechoslovakia | 99.9 /100 | #46 | Exceptional $62,217 |
| Immigrants | Austria | 99.9 /100 | #47 | Exceptional $62,164 |
| Immigrants | Malaysia | 99.9 /100 | #48 | Exceptional $62,121 |
| Immigrants | Europe | 99.9 /100 | #49 | Exceptional $62,057 |
| Bhutanese | 99.9 /100 | #50 | Exceptional $61,759 |
| Estonians | 99.9 /100 | #51 | Exceptional $61,710 |