Subsaharan African vs Hawaiian Median Male Earnings
COMPARE
Subsaharan African
Hawaiian
Median Male Earnings
Median Male Earnings Comparison
Sub-Saharan Africans
Hawaiians
$50,408
MEDIAN MALE EARNINGS
1.8/ 100
METRIC RATING
247th/ 347
METRIC RANK
$50,488
MEDIAN MALE EARNINGS
1.9/ 100
METRIC RATING
245th/ 347
METRIC RANK
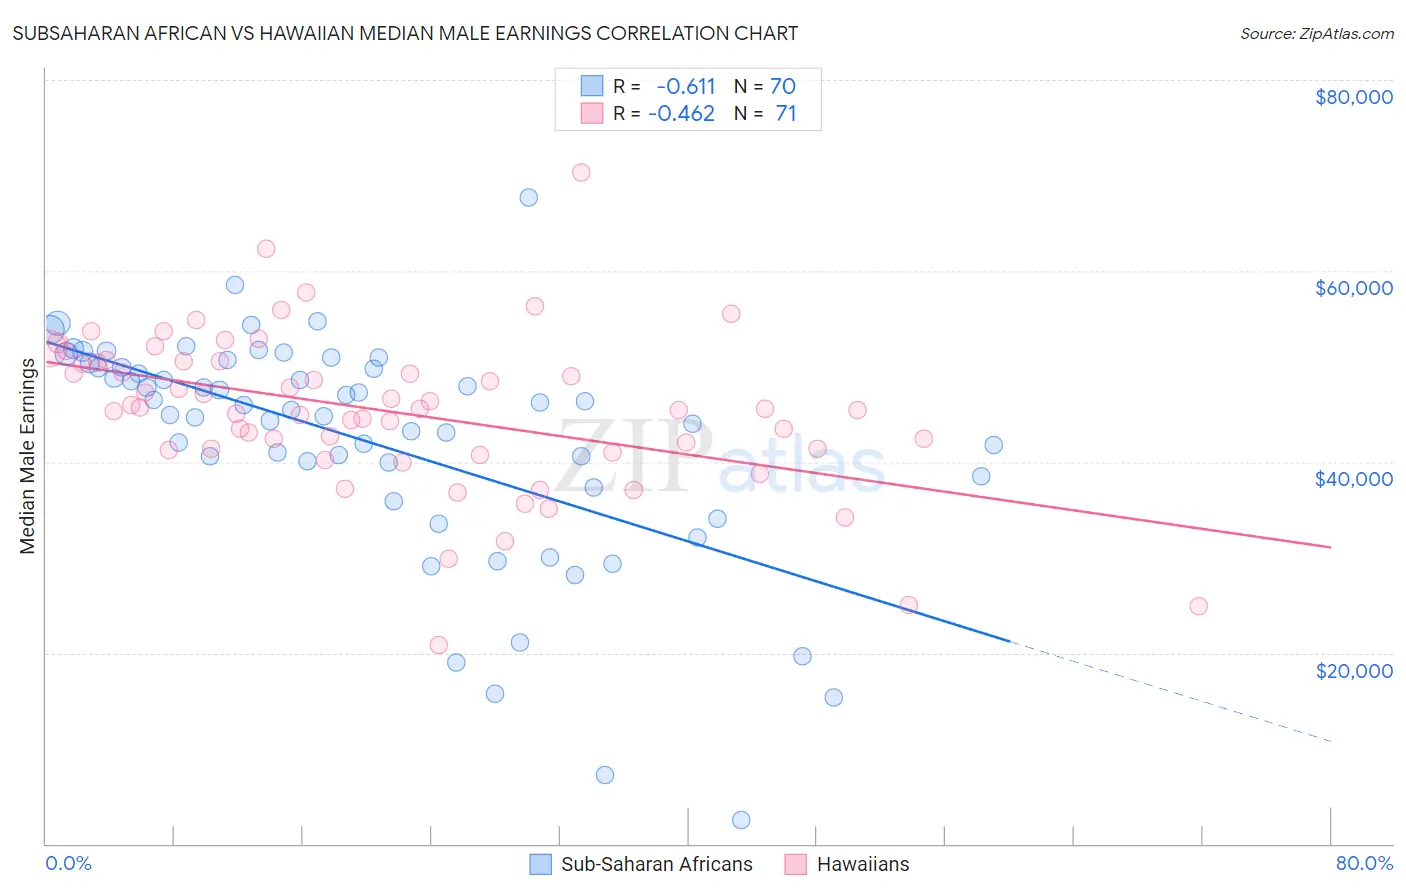
Subsaharan African vs Hawaiian Median Male Earnings Correlation Chart
The statistical analysis conducted on geographies consisting of 507,818,984 people shows a significant negative correlation between the proportion of Sub-Saharan Africans and median male earnings in the United States with a correlation coefficient (R) of -0.611 and weighted average of $50,408. Similarly, the statistical analysis conducted on geographies consisting of 327,518,939 people shows a moderate negative correlation between the proportion of Hawaiians and median male earnings in the United States with a correlation coefficient (R) of -0.462 and weighted average of $50,488, a difference of 0.16%.
Median Male Earnings Correlation Summary
| Measurement | Subsaharan African | Hawaiian |
| Minimum | $2,499 | $20,774 |
| Maximum | $67,727 | $70,362 |
| Range | $65,228 | $49,588 |
| Mean | $42,175 | $45,275 |
| Median | $45,761 | $45,568 |
| Interquartile 25% (IQ1) | $38,471 | $41,232 |
| Interquartile 75% (IQ3) | $49,902 | $50,512 |
| Interquartile Range (IQR) | $11,431 | $9,280 |
| Standard Deviation (Sample) | $12,034 | $8,332 |
| Standard Deviation (Population) | $11,948 | $8,273 |
Demographics Similar to Sub-Saharan Africans and Hawaiians by Median Male Earnings
In terms of median male earnings, the demographic groups most similar to Sub-Saharan Africans are Immigrants from Ecuador ($50,474, a difference of 0.13%), Immigrants from Guyana ($50,321, a difference of 0.17%), Immigrants from Burma/Myanmar ($50,298, a difference of 0.22%), Osage ($50,292, a difference of 0.23%), and Immigrants from Grenada ($50,279, a difference of 0.26%). Similarly, the demographic groups most similar to Hawaiians are Immigrants from Ecuador ($50,474, a difference of 0.030%), Houma ($50,547, a difference of 0.12%), French American Indian ($50,611, a difference of 0.24%), Guyanese ($50,613, a difference of 0.25%), and Immigrants from Guyana ($50,321, a difference of 0.33%).
| Demographics | Rating | Rank | Median Male Earnings |
| Pennsylvania Germans | 2.8 /100 | #236 | Tragic $50,878 |
| Immigrants | Barbados | 2.6 /100 | #237 | Tragic $50,795 |
| Malaysians | 2.5 /100 | #238 | Tragic $50,772 |
| Americans | 2.5 /100 | #239 | Tragic $50,761 |
| West Indians | 2.3 /100 | #240 | Tragic $50,682 |
| Immigrants | St. Vincent and the Grenadines | 2.3 /100 | #241 | Tragic $50,665 |
| Guyanese | 2.2 /100 | #242 | Tragic $50,613 |
| French American Indians | 2.2 /100 | #243 | Tragic $50,611 |
| Houma | 2.0 /100 | #244 | Tragic $50,547 |
| Hawaiians | 1.9 /100 | #245 | Tragic $50,488 |
| Immigrants | Ecuador | 1.9 /100 | #246 | Tragic $50,474 |
| Sub-Saharan Africans | 1.8 /100 | #247 | Tragic $50,408 |
| Immigrants | Guyana | 1.6 /100 | #248 | Tragic $50,321 |
| Immigrants | Burma/Myanmar | 1.6 /100 | #249 | Tragic $50,298 |
| Osage | 1.6 /100 | #250 | Tragic $50,292 |
| Immigrants | Grenada | 1.6 /100 | #251 | Tragic $50,279 |
| Immigrants | Cabo Verde | 1.2 /100 | #252 | Tragic $50,009 |
| German Russians | 1.1 /100 | #253 | Tragic $49,924 |
| Senegalese | 1.0 /100 | #254 | Tragic $49,774 |
| Alaskan Athabascans | 0.9 /100 | #255 | Tragic $49,748 |
| Alaska Natives | 0.9 /100 | #256 | Tragic $49,711 |