Crow vs Immigrants from Nigeria Householder Income Under 25 years
COMPARE
Crow
Immigrants from Nigeria
Householder Income Under 25 years
Householder Income Under 25 years Comparison
Crow
Immigrants from Nigeria
$47,012
HOUSEHOLDER INCOME UNDER 25 YEARS
0.0/ 100
METRIC RATING
315th/ 347
METRIC RANK
$49,174
HOUSEHOLDER INCOME UNDER 25 YEARS
0.1/ 100
METRIC RATING
283rd/ 347
METRIC RANK
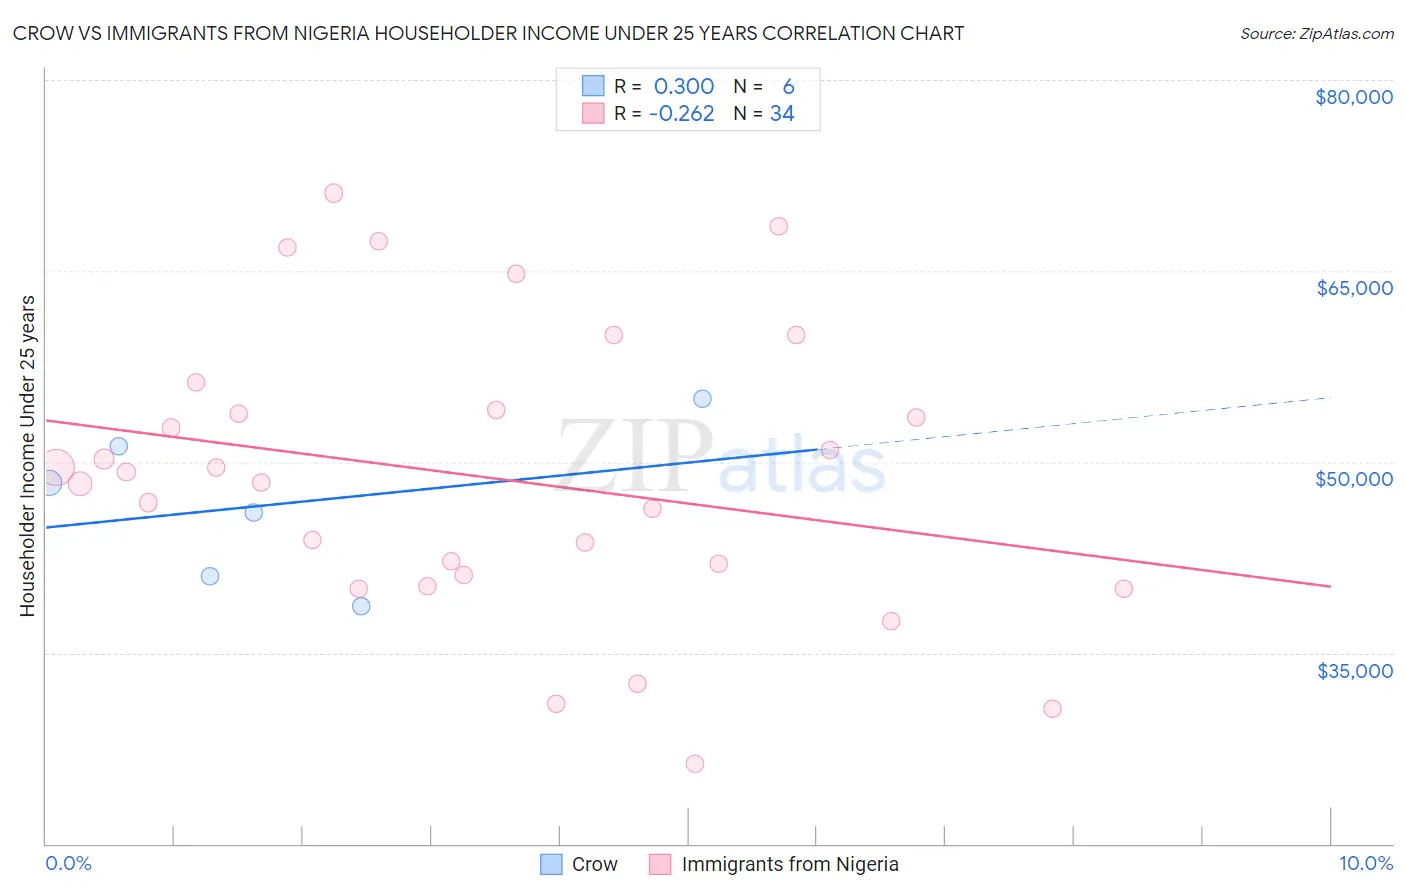
Crow vs Immigrants from Nigeria Householder Income Under 25 years Correlation Chart
The statistical analysis conducted on geographies consisting of 57,021,260 people shows a mild positive correlation between the proportion of Crow and household income with householder under the age of 25 in the United States with a correlation coefficient (R) of 0.300 and weighted average of $47,012. Similarly, the statistical analysis conducted on geographies consisting of 250,876,888 people shows a weak negative correlation between the proportion of Immigrants from Nigeria and household income with householder under the age of 25 in the United States with a correlation coefficient (R) of -0.262 and weighted average of $49,174, a difference of 4.6%.
Householder Income Under 25 years Correlation Summary
| Measurement | Crow | Immigrants from Nigeria |
| Minimum | $38,660 | $26,315 |
| Maximum | $55,000 | $71,114 |
| Range | $16,340 | $44,799 |
| Mean | $46,718 | $48,800 |
| Median | $47,186 | $48,781 |
| Interquartile 25% (IQ1) | $41,057 | $41,112 |
| Interquartile 75% (IQ3) | $51,221 | $54,053 |
| Interquartile Range (IQR) | $10,164 | $12,941 |
| Standard Deviation (Sample) | $6,149 | $11,278 |
| Standard Deviation (Population) | $5,613 | $11,111 |
Similar Demographics by Householder Income Under 25 years
Demographics Similar to Crow by Householder Income Under 25 years
In terms of householder income under 25 years, the demographic groups most similar to Crow are Chippewa ($47,015, a difference of 0.010%), Sudanese ($46,982, a difference of 0.060%), Hopi ($46,978, a difference of 0.070%), Spanish American ($46,913, a difference of 0.21%), and Delaware ($47,159, a difference of 0.31%).
| Demographics | Rating | Rank | Householder Income Under 25 years |
| Comanche | 0.0 /100 | #308 | Tragic $47,518 |
| U.S. Virgin Islanders | 0.0 /100 | #309 | Tragic $47,448 |
| Iroquois | 0.0 /100 | #310 | Tragic $47,380 |
| Ottawa | 0.0 /100 | #311 | Tragic $47,366 |
| Bermudans | 0.0 /100 | #312 | Tragic $47,359 |
| Delaware | 0.0 /100 | #313 | Tragic $47,159 |
| Chippewa | 0.0 /100 | #314 | Tragic $47,015 |
| Crow | 0.0 /100 | #315 | Tragic $47,012 |
| Sudanese | 0.0 /100 | #316 | Tragic $46,982 |
| Hopi | 0.0 /100 | #317 | Tragic $46,978 |
| Spanish Americans | 0.0 /100 | #318 | Tragic $46,913 |
| Africans | 0.0 /100 | #319 | Tragic $46,838 |
| Immigrants | Sudan | 0.0 /100 | #320 | Tragic $46,791 |
| Potawatomi | 0.0 /100 | #321 | Tragic $46,462 |
| Sioux | 0.0 /100 | #322 | Tragic $46,417 |
Demographics Similar to Immigrants from Nigeria by Householder Income Under 25 years
In terms of householder income under 25 years, the demographic groups most similar to Immigrants from Nigeria are Carpatho Rusyn ($49,113, a difference of 0.12%), Alsatian ($49,267, a difference of 0.19%), Scotch-Irish ($49,039, a difference of 0.28%), Nonimmigrants ($49,348, a difference of 0.35%), and Hmong ($49,364, a difference of 0.39%).
| Demographics | Rating | Rank | Householder Income Under 25 years |
| Dominicans | 0.2 /100 | #276 | Tragic $49,633 |
| Immigrants | Western Africa | 0.2 /100 | #277 | Tragic $49,621 |
| Nigerians | 0.1 /100 | #278 | Tragic $49,416 |
| Apache | 0.1 /100 | #279 | Tragic $49,395 |
| Hmong | 0.1 /100 | #280 | Tragic $49,364 |
| Immigrants | Nonimmigrants | 0.1 /100 | #281 | Tragic $49,348 |
| Alsatians | 0.1 /100 | #282 | Tragic $49,267 |
| Immigrants | Nigeria | 0.1 /100 | #283 | Tragic $49,174 |
| Carpatho Rusyns | 0.1 /100 | #284 | Tragic $49,113 |
| Scotch-Irish | 0.0 /100 | #285 | Tragic $49,039 |
| French American Indians | 0.0 /100 | #286 | Tragic $48,977 |
| Senegalese | 0.0 /100 | #287 | Tragic $48,953 |
| Liberians | 0.0 /100 | #288 | Tragic $48,917 |
| Hondurans | 0.0 /100 | #289 | Tragic $48,885 |
| Americans | 0.0 /100 | #290 | Tragic $48,860 |