Pima vs Dutch Householder Income Under 25 years
COMPARE
Pima
Dutch
Householder Income Under 25 years
Householder Income Under 25 years Comparison
Pima
Dutch
$51,503
HOUSEHOLDER INCOME UNDER 25 YEARS
15.7/ 100
METRIC RATING
197th/ 347
METRIC RANK
$51,265
HOUSEHOLDER INCOME UNDER 25 YEARS
9.4/ 100
METRIC RATING
213th/ 347
METRIC RANK
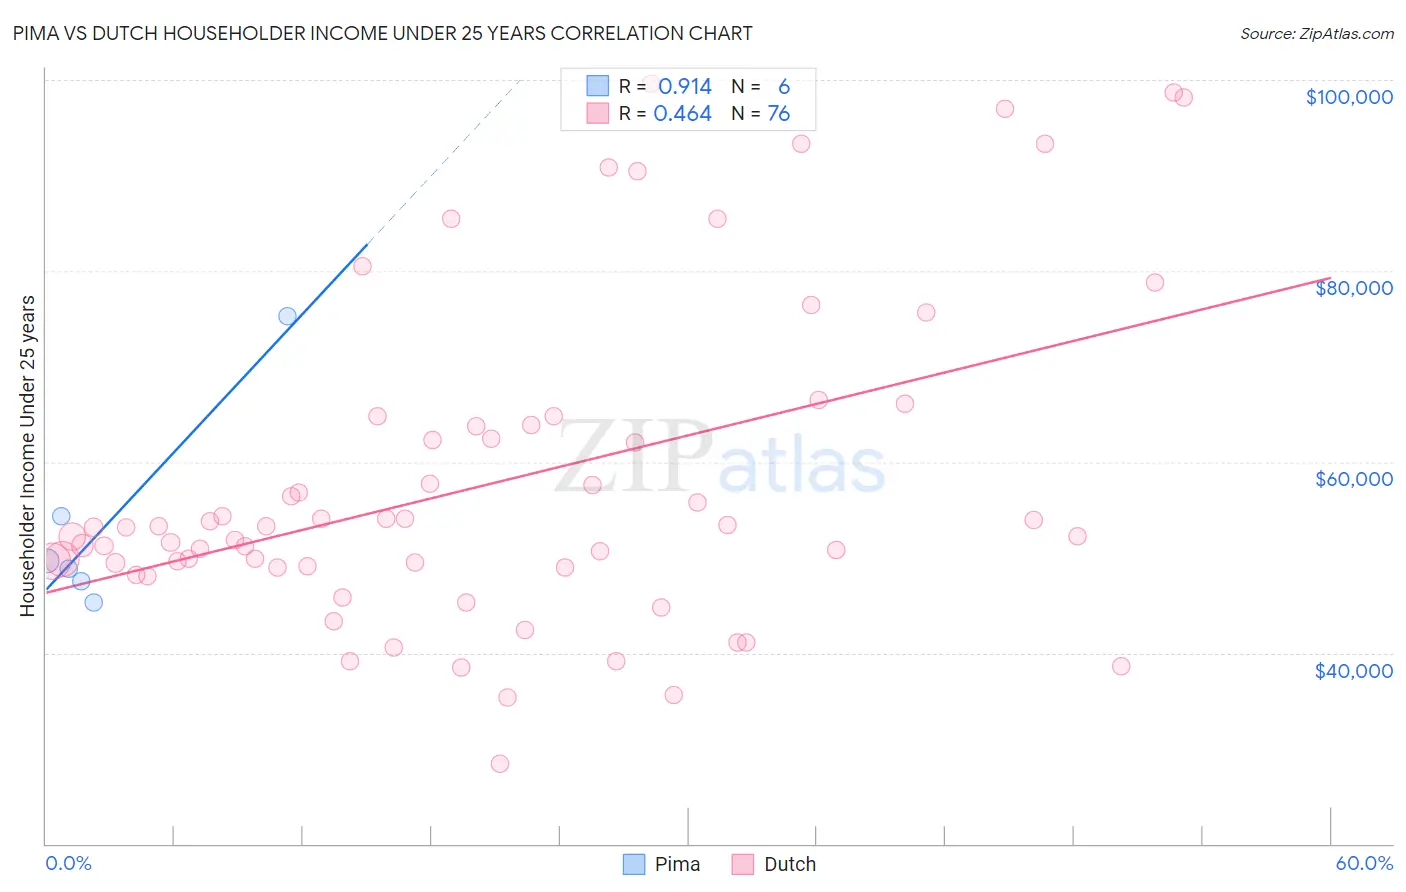
Pima vs Dutch Householder Income Under 25 years Correlation Chart
The statistical analysis conducted on geographies consisting of 59,375,997 people shows a near-perfect positive correlation between the proportion of Pima and household income with householder under the age of 25 in the United States with a correlation coefficient (R) of 0.914 and weighted average of $51,503. Similarly, the statistical analysis conducted on geographies consisting of 431,004,830 people shows a moderate positive correlation between the proportion of Dutch and household income with householder under the age of 25 in the United States with a correlation coefficient (R) of 0.464 and weighted average of $51,265, a difference of 0.47%.
Householder Income Under 25 years Correlation Summary
| Measurement | Pima | Dutch |
| Minimum | $45,215 | $28,378 |
| Maximum | $75,313 | $99,620 |
| Range | $30,098 | $71,242 |
| Mean | $53,455 | $57,868 |
| Median | $49,199 | $53,119 |
| Interquartile 25% (IQ1) | $47,558 | $49,046 |
| Interquartile 75% (IQ3) | $54,244 | $63,833 |
| Interquartile Range (IQR) | $6,685 | $14,787 |
| Standard Deviation (Sample) | $11,115 | $16,885 |
| Standard Deviation (Population) | $10,146 | $16,773 |
Demographics Similar to Pima and Dutch by Householder Income Under 25 years
In terms of householder income under 25 years, the demographic groups most similar to Pima are Palestinian ($51,515, a difference of 0.020%), Immigrants from Syria ($51,494, a difference of 0.020%), Swiss ($51,493, a difference of 0.020%), Estonian ($51,523, a difference of 0.040%), and Immigrants from West Indies ($51,479, a difference of 0.050%). Similarly, the demographic groups most similar to Dutch are Zimbabwean ($51,259, a difference of 0.010%), Immigrants from Panama ($51,278, a difference of 0.030%), Icelander ($51,247, a difference of 0.030%), Irish ($51,317, a difference of 0.10%), and Immigrants from Ghana ($51,333, a difference of 0.13%).
| Demographics | Rating | Rank | Householder Income Under 25 years |
| Estonians | 16.4 /100 | #195 | Poor $51,523 |
| Palestinians | 16.1 /100 | #196 | Poor $51,515 |
| Pima | 15.7 /100 | #197 | Poor $51,503 |
| Immigrants | Syria | 15.4 /100 | #198 | Poor $51,494 |
| Swiss | 15.4 /100 | #199 | Poor $51,493 |
| Immigrants | West Indies | 14.9 /100 | #200 | Poor $51,479 |
| British | 14.9 /100 | #201 | Poor $51,477 |
| Immigrants | Guatemala | 14.0 /100 | #202 | Poor $51,447 |
| Immigrants | Cameroon | 13.6 /100 | #203 | Poor $51,433 |
| Czechs | 13.2 /100 | #204 | Poor $51,421 |
| Cape Verdeans | 12.3 /100 | #205 | Poor $51,387 |
| Immigrants | Latin America | 12.3 /100 | #206 | Poor $51,387 |
| South Africans | 12.2 /100 | #207 | Poor $51,383 |
| Immigrants | Jordan | 11.9 /100 | #208 | Poor $51,370 |
| Syrians | 11.4 /100 | #209 | Poor $51,353 |
| Immigrants | Ghana | 10.9 /100 | #210 | Poor $51,333 |
| Irish | 10.6 /100 | #211 | Poor $51,317 |
| Immigrants | Panama | 9.7 /100 | #212 | Tragic $51,278 |
| Dutch | 9.4 /100 | #213 | Tragic $51,265 |
| Zimbabweans | 9.3 /100 | #214 | Tragic $51,259 |
| Icelanders | 9.1 /100 | #215 | Tragic $51,247 |