Hopi vs Houma Householder Income Over 65 years
COMPARE
Hopi
Houma
Householder Income Over 65 years
Householder Income Over 65 years Comparison
Hopi
Houma
$50,925
HOUSEHOLDER INCOME OVER 65 YEARS
0.0/ 100
METRIC RATING
328th/ 347
METRIC RANK
$44,822
HOUSEHOLDER INCOME OVER 65 YEARS
0.0/ 100
METRIC RATING
344th/ 347
METRIC RANK
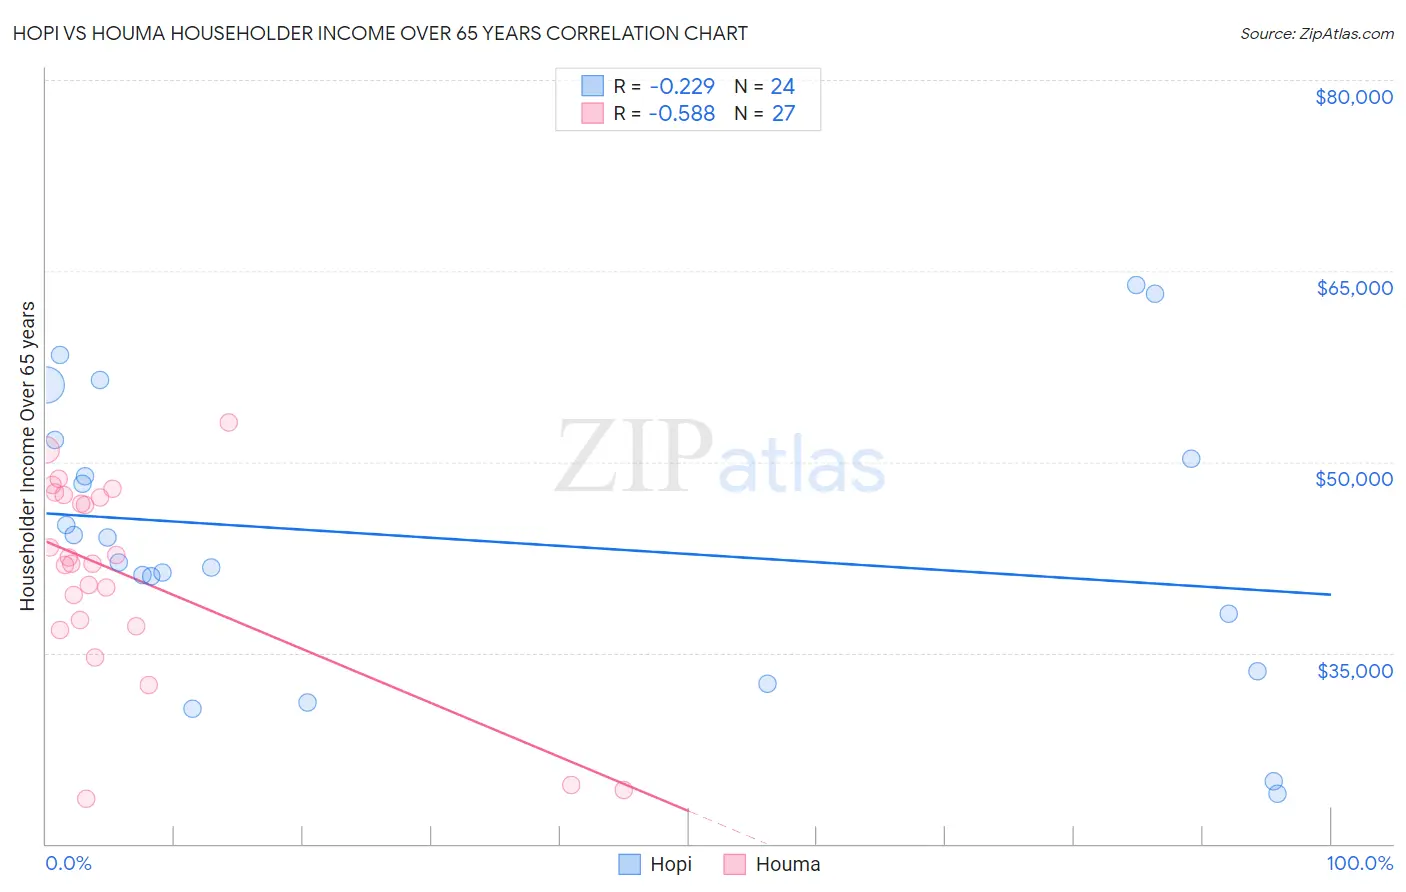
Hopi vs Houma Householder Income Over 65 years Correlation Chart
The statistical analysis conducted on geographies consisting of 74,624,993 people shows a weak negative correlation between the proportion of Hopi and household income with householder over the age of 65 in the United States with a correlation coefficient (R) of -0.229 and weighted average of $50,925. Similarly, the statistical analysis conducted on geographies consisting of 36,737,903 people shows a substantial negative correlation between the proportion of Houma and household income with householder over the age of 65 in the United States with a correlation coefficient (R) of -0.588 and weighted average of $44,822, a difference of 13.6%.
Householder Income Over 65 years Correlation Summary
| Measurement | Hopi | Houma |
| Minimum | $23,945 | $23,495 |
| Maximum | $63,889 | $53,137 |
| Range | $39,944 | $29,642 |
| Mean | $43,849 | $41,091 |
| Median | $43,086 | $42,014 |
| Interquartile 25% (IQ1) | $35,807 | $37,039 |
| Interquartile 75% (IQ3) | $50,986 | $47,429 |
| Interquartile Range (IQR) | $15,179 | $10,390 |
| Standard Deviation (Sample) | $11,101 | $7,902 |
| Standard Deviation (Population) | $10,867 | $7,754 |
Demographics Similar to Hopi and Houma by Householder Income Over 65 years
In terms of householder income over 65 years, the demographic groups most similar to Hopi are Bahamian ($51,000, a difference of 0.15%), Black/African American ($50,779, a difference of 0.29%), Immigrants from Grenada ($50,747, a difference of 0.35%), Kiowa ($51,140, a difference of 0.42%), and Pima ($50,539, a difference of 0.76%). Similarly, the demographic groups most similar to Houma are Immigrants from Cuba ($44,735, a difference of 0.19%), Immigrants from Dominican Republic ($45,758, a difference of 2.1%), Immigrants from Cabo Verde ($46,654, a difference of 4.1%), Dominican ($46,964, a difference of 4.8%), and Puerto Rican ($42,550, a difference of 5.3%).
| Demographics | Rating | Rank | Householder Income Over 65 years |
| Kiowa | 0.0 /100 | #326 | Tragic $51,140 |
| Bahamians | 0.0 /100 | #327 | Tragic $51,000 |
| Hopi | 0.0 /100 | #328 | Tragic $50,925 |
| Blacks/African Americans | 0.0 /100 | #329 | Tragic $50,779 |
| Immigrants | Grenada | 0.0 /100 | #330 | Tragic $50,747 |
| Pima | 0.0 /100 | #331 | Tragic $50,539 |
| Dutch West Indians | 0.0 /100 | #332 | Tragic $50,475 |
| Cape Verdeans | 0.0 /100 | #333 | Tragic $50,077 |
| Immigrants | Dominica | 0.0 /100 | #334 | Tragic $50,071 |
| Crow | 0.0 /100 | #335 | Tragic $49,234 |
| Cubans | 0.0 /100 | #336 | Tragic $49,152 |
| Tohono O'odham | 0.0 /100 | #337 | Tragic $49,121 |
| Immigrants | Caribbean | 0.0 /100 | #338 | Tragic $48,535 |
| Navajo | 0.0 /100 | #339 | Tragic $47,722 |
| Immigrants | Yemen | 0.0 /100 | #340 | Tragic $47,527 |
| Dominicans | 0.0 /100 | #341 | Tragic $46,964 |
| Immigrants | Cabo Verde | 0.0 /100 | #342 | Tragic $46,654 |
| Immigrants | Dominican Republic | 0.0 /100 | #343 | Tragic $45,758 |
| Houma | 0.0 /100 | #344 | Tragic $44,822 |
| Immigrants | Cuba | 0.0 /100 | #345 | Tragic $44,735 |
| Puerto Ricans | 0.0 /100 | #346 | Tragic $42,550 |