Hispanic or Latino vs Houma Householder Income Over 65 years
COMPARE
Hispanic or Latino
Houma
Householder Income Over 65 years
Householder Income Over 65 years Comparison
Hispanics or Latinos
Houma
$52,832
HOUSEHOLDER INCOME OVER 65 YEARS
0.0/ 100
METRIC RATING
307th/ 347
METRIC RANK
$44,822
HOUSEHOLDER INCOME OVER 65 YEARS
0.0/ 100
METRIC RATING
344th/ 347
METRIC RANK
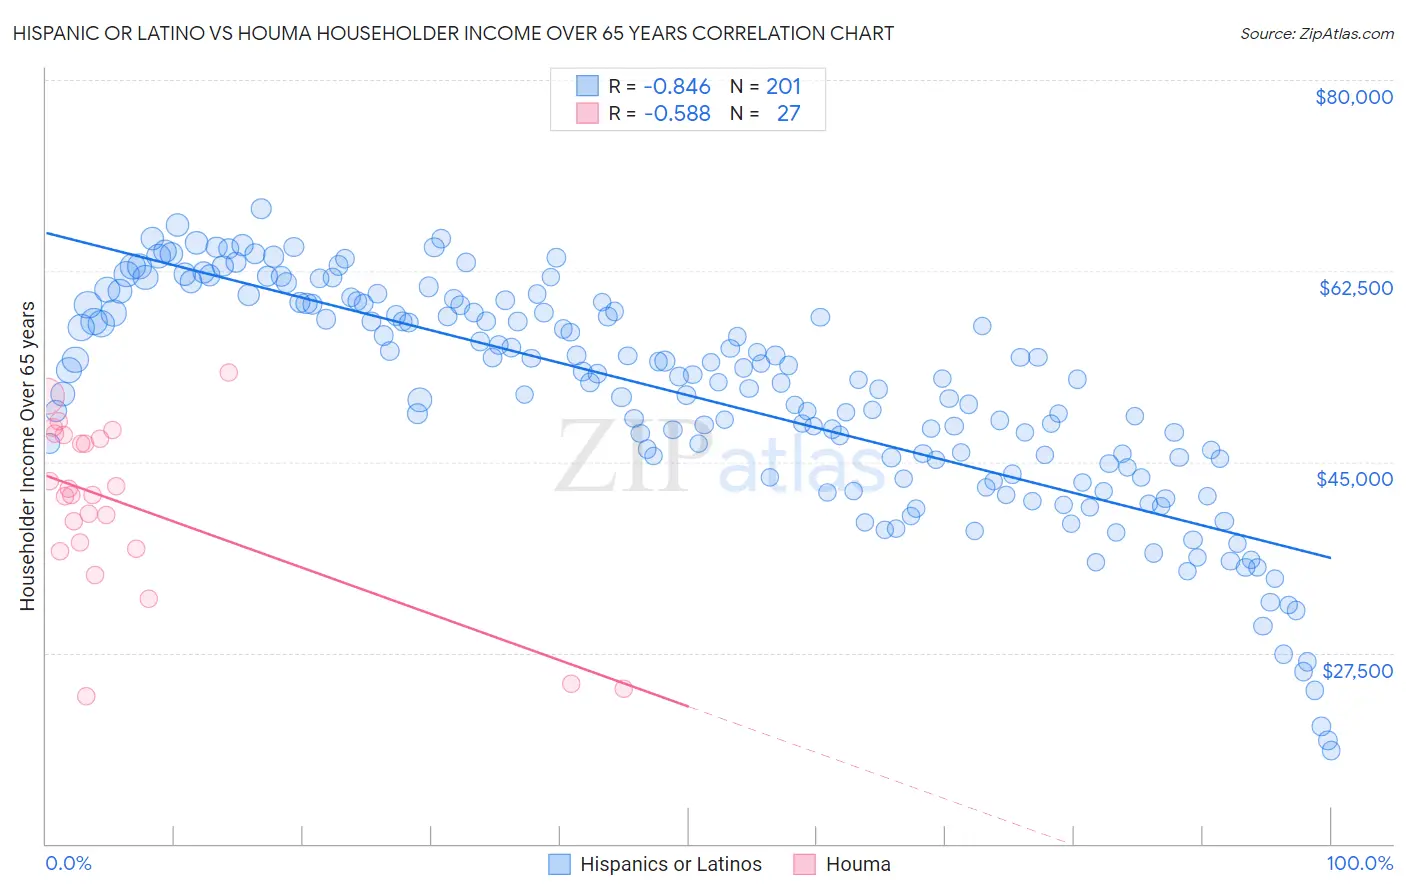
Hispanic or Latino vs Houma Householder Income Over 65 years Correlation Chart
The statistical analysis conducted on geographies consisting of 572,369,313 people shows a very strong negative correlation between the proportion of Hispanics or Latinos and household income with householder over the age of 65 in the United States with a correlation coefficient (R) of -0.846 and weighted average of $52,832. Similarly, the statistical analysis conducted on geographies consisting of 36,737,903 people shows a substantial negative correlation between the proportion of Houma and household income with householder over the age of 65 in the United States with a correlation coefficient (R) of -0.588 and weighted average of $44,822, a difference of 17.9%.
Householder Income Over 65 years Correlation Summary
| Measurement | Hispanic or Latino | Houma |
| Minimum | $18,538 | $23,495 |
| Maximum | $68,171 | $53,137 |
| Range | $49,633 | $29,642 |
| Mean | $51,010 | $41,091 |
| Median | $52,570 | $42,014 |
| Interquartile 25% (IQ1) | $44,659 | $37,039 |
| Interquartile 75% (IQ3) | $59,438 | $47,429 |
| Interquartile Range (IQR) | $14,779 | $10,390 |
| Standard Deviation (Sample) | $10,248 | $7,902 |
| Standard Deviation (Population) | $10,222 | $7,754 |
Similar Demographics by Householder Income Over 65 years
Demographics Similar to Hispanics or Latinos by Householder Income Over 65 years
In terms of householder income over 65 years, the demographic groups most similar to Hispanics or Latinos are Immigrants from Mexico ($52,801, a difference of 0.060%), Pennsylvania German ($52,888, a difference of 0.11%), Pueblo ($52,930, a difference of 0.19%), Ute ($52,949, a difference of 0.22%), and Honduran ($52,634, a difference of 0.38%).
| Demographics | Rating | Rank | Householder Income Over 65 years |
| Immigrants | Bahamas | 0.0 /100 | #300 | Tragic $53,174 |
| Yuman | 0.0 /100 | #301 | Tragic $53,110 |
| Spanish American Indians | 0.0 /100 | #302 | Tragic $53,077 |
| Choctaw | 0.0 /100 | #303 | Tragic $53,060 |
| Ute | 0.0 /100 | #304 | Tragic $52,949 |
| Pueblo | 0.0 /100 | #305 | Tragic $52,930 |
| Pennsylvania Germans | 0.0 /100 | #306 | Tragic $52,888 |
| Hispanics or Latinos | 0.0 /100 | #307 | Tragic $52,832 |
| Immigrants | Mexico | 0.0 /100 | #308 | Tragic $52,801 |
| Hondurans | 0.0 /100 | #309 | Tragic $52,634 |
| Sioux | 0.0 /100 | #310 | Tragic $52,509 |
| Seminole | 0.0 /100 | #311 | Tragic $52,373 |
| Immigrants | Azores | 0.0 /100 | #312 | Tragic $52,121 |
| Immigrants | Nicaragua | 0.0 /100 | #313 | Tragic $52,085 |
| Natives/Alaskans | 0.0 /100 | #314 | Tragic $52,081 |
Demographics Similar to Houma by Householder Income Over 65 years
In terms of householder income over 65 years, the demographic groups most similar to Houma are Immigrants from Cuba ($44,735, a difference of 0.19%), Immigrants from Dominican Republic ($45,758, a difference of 2.1%), Immigrants from Cabo Verde ($46,654, a difference of 4.1%), Dominican ($46,964, a difference of 4.8%), and Puerto Rican ($42,550, a difference of 5.3%).
| Demographics | Rating | Rank | Householder Income Over 65 years |
| Cape Verdeans | 0.0 /100 | #333 | Tragic $50,077 |
| Immigrants | Dominica | 0.0 /100 | #334 | Tragic $50,071 |
| Crow | 0.0 /100 | #335 | Tragic $49,234 |
| Cubans | 0.0 /100 | #336 | Tragic $49,152 |
| Tohono O'odham | 0.0 /100 | #337 | Tragic $49,121 |
| Immigrants | Caribbean | 0.0 /100 | #338 | Tragic $48,535 |
| Navajo | 0.0 /100 | #339 | Tragic $47,722 |
| Immigrants | Yemen | 0.0 /100 | #340 | Tragic $47,527 |
| Dominicans | 0.0 /100 | #341 | Tragic $46,964 |
| Immigrants | Cabo Verde | 0.0 /100 | #342 | Tragic $46,654 |
| Immigrants | Dominican Republic | 0.0 /100 | #343 | Tragic $45,758 |
| Houma | 0.0 /100 | #344 | Tragic $44,822 |
| Immigrants | Cuba | 0.0 /100 | #345 | Tragic $44,735 |
| Puerto Ricans | 0.0 /100 | #346 | Tragic $42,550 |
| Lumbee | 0.0 /100 | #347 | Tragic $40,550 |