Spanish American Indian vs Houma Householder Income Over 65 years
COMPARE
Spanish American Indian
Houma
Householder Income Over 65 years
Householder Income Over 65 years Comparison
Spanish American Indians
Houma
$53,077
HOUSEHOLDER INCOME OVER 65 YEARS
0.0/ 100
METRIC RATING
302nd/ 347
METRIC RANK
$44,822
HOUSEHOLDER INCOME OVER 65 YEARS
0.0/ 100
METRIC RATING
344th/ 347
METRIC RANK
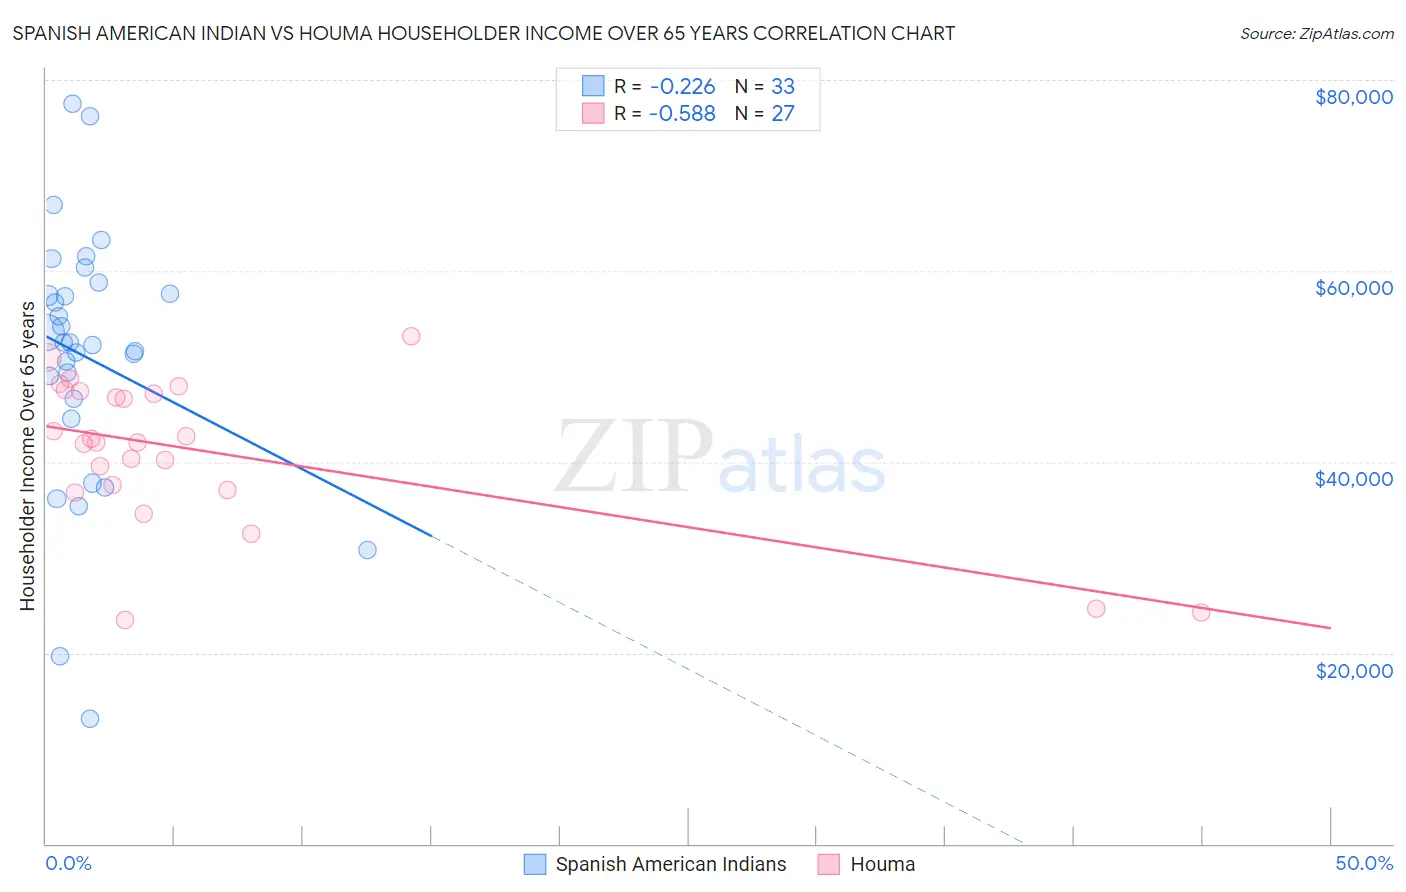
Spanish American Indian vs Houma Householder Income Over 65 years Correlation Chart
The statistical analysis conducted on geographies consisting of 73,128,660 people shows a weak negative correlation between the proportion of Spanish American Indians and household income with householder over the age of 65 in the United States with a correlation coefficient (R) of -0.226 and weighted average of $53,077. Similarly, the statistical analysis conducted on geographies consisting of 36,737,903 people shows a substantial negative correlation between the proportion of Houma and household income with householder over the age of 65 in the United States with a correlation coefficient (R) of -0.588 and weighted average of $44,822, a difference of 18.4%.
Householder Income Over 65 years Correlation Summary
| Measurement | Spanish American Indian | Houma |
| Minimum | $13,050 | $23,495 |
| Maximum | $77,490 | $53,137 |
| Range | $64,440 | $29,642 |
| Mean | $50,895 | $41,091 |
| Median | $52,508 | $42,014 |
| Interquartile 25% (IQ1) | $45,560 | $37,039 |
| Interquartile 75% (IQ3) | $58,154 | $47,429 |
| Interquartile Range (IQR) | $12,594 | $10,390 |
| Standard Deviation (Sample) | $13,736 | $7,902 |
| Standard Deviation (Population) | $13,526 | $7,754 |
Similar Demographics by Householder Income Over 65 years
Demographics Similar to Spanish American Indians by Householder Income Over 65 years
In terms of householder income over 65 years, the demographic groups most similar to Spanish American Indians are Choctaw ($53,060, a difference of 0.030%), Yuman ($53,110, a difference of 0.060%), Immigrants from Bahamas ($53,174, a difference of 0.18%), Ute ($52,949, a difference of 0.24%), and Ottawa ($53,217, a difference of 0.27%).
| Demographics | Rating | Rank | Householder Income Over 65 years |
| Immigrants | Central America | 0.0 /100 | #295 | Tragic $53,420 |
| Immigrants | Somalia | 0.0 /100 | #296 | Tragic $53,333 |
| Immigrants | Latin America | 0.0 /100 | #297 | Tragic $53,265 |
| Central American Indians | 0.0 /100 | #298 | Tragic $53,232 |
| Ottawa | 0.0 /100 | #299 | Tragic $53,217 |
| Immigrants | Bahamas | 0.0 /100 | #300 | Tragic $53,174 |
| Yuman | 0.0 /100 | #301 | Tragic $53,110 |
| Spanish American Indians | 0.0 /100 | #302 | Tragic $53,077 |
| Choctaw | 0.0 /100 | #303 | Tragic $53,060 |
| Ute | 0.0 /100 | #304 | Tragic $52,949 |
| Pueblo | 0.0 /100 | #305 | Tragic $52,930 |
| Pennsylvania Germans | 0.0 /100 | #306 | Tragic $52,888 |
| Hispanics or Latinos | 0.0 /100 | #307 | Tragic $52,832 |
| Immigrants | Mexico | 0.0 /100 | #308 | Tragic $52,801 |
| Hondurans | 0.0 /100 | #309 | Tragic $52,634 |
Demographics Similar to Houma by Householder Income Over 65 years
In terms of householder income over 65 years, the demographic groups most similar to Houma are Immigrants from Cuba ($44,735, a difference of 0.19%), Immigrants from Dominican Republic ($45,758, a difference of 2.1%), Immigrants from Cabo Verde ($46,654, a difference of 4.1%), Dominican ($46,964, a difference of 4.8%), and Puerto Rican ($42,550, a difference of 5.3%).
| Demographics | Rating | Rank | Householder Income Over 65 years |
| Cape Verdeans | 0.0 /100 | #333 | Tragic $50,077 |
| Immigrants | Dominica | 0.0 /100 | #334 | Tragic $50,071 |
| Crow | 0.0 /100 | #335 | Tragic $49,234 |
| Cubans | 0.0 /100 | #336 | Tragic $49,152 |
| Tohono O'odham | 0.0 /100 | #337 | Tragic $49,121 |
| Immigrants | Caribbean | 0.0 /100 | #338 | Tragic $48,535 |
| Navajo | 0.0 /100 | #339 | Tragic $47,722 |
| Immigrants | Yemen | 0.0 /100 | #340 | Tragic $47,527 |
| Dominicans | 0.0 /100 | #341 | Tragic $46,964 |
| Immigrants | Cabo Verde | 0.0 /100 | #342 | Tragic $46,654 |
| Immigrants | Dominican Republic | 0.0 /100 | #343 | Tragic $45,758 |
| Houma | 0.0 /100 | #344 | Tragic $44,822 |
| Immigrants | Cuba | 0.0 /100 | #345 | Tragic $44,735 |
| Puerto Ricans | 0.0 /100 | #346 | Tragic $42,550 |
| Lumbee | 0.0 /100 | #347 | Tragic $40,550 |