Brazilian vs Austrian Median Male Earnings
COMPARE
Brazilian
Austrian
Median Male Earnings
Median Male Earnings Comparison
Brazilians
Austrians
$56,837
MEDIAN MALE EARNINGS
90.9/ 100
METRIC RATING
127th/ 347
METRIC RANK
$59,359
MEDIAN MALE EARNINGS
99.2/ 100
METRIC RATING
90th/ 347
METRIC RANK
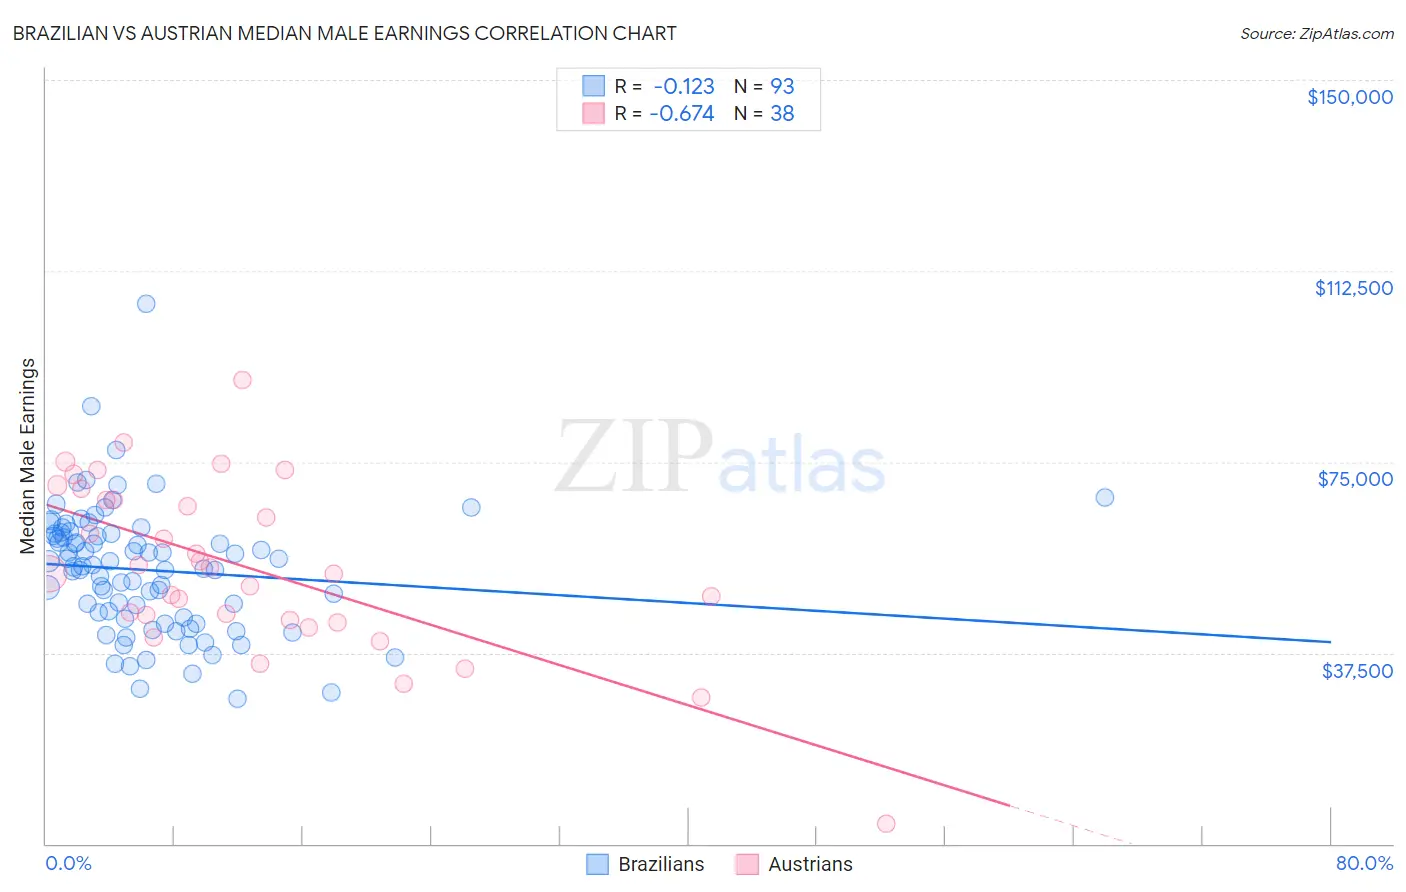
Brazilian vs Austrian Median Male Earnings Correlation Chart
The statistical analysis conducted on geographies consisting of 323,892,839 people shows a poor negative correlation between the proportion of Brazilians and median male earnings in the United States with a correlation coefficient (R) of -0.123 and weighted average of $56,837. Similarly, the statistical analysis conducted on geographies consisting of 451,854,520 people shows a significant negative correlation between the proportion of Austrians and median male earnings in the United States with a correlation coefficient (R) of -0.674 and weighted average of $59,359, a difference of 4.4%.
Median Male Earnings Correlation Summary
| Measurement | Brazilian | Austrian |
| Minimum | $28,554 | $3,902 |
| Maximum | $105,938 | $91,143 |
| Range | $77,384 | $87,241 |
| Mean | $53,733 | $54,430 |
| Median | $54,435 | $53,632 |
| Interquartile 25% (IQ1) | $44,298 | $43,967 |
| Interquartile 75% (IQ3) | $60,844 | $67,629 |
| Interquartile Range (IQR) | $16,546 | $23,662 |
| Standard Deviation (Sample) | $12,418 | $16,958 |
| Standard Deviation (Population) | $12,351 | $16,734 |
Similar Demographics by Median Male Earnings
Demographics Similar to Brazilians by Median Male Earnings
In terms of median male earnings, the demographic groups most similar to Brazilians are Immigrants from Syria ($56,830, a difference of 0.010%), Chinese ($56,872, a difference of 0.060%), Immigrants from Morocco ($56,958, a difference of 0.21%), Pakistani ($56,719, a difference of 0.21%), and Chilean ($56,973, a difference of 0.24%).
| Demographics | Rating | Rank | Median Male Earnings |
| Canadians | 93.9 /100 | #120 | Exceptional $57,286 |
| Immigrants | Albania | 93.3 /100 | #121 | Exceptional $57,179 |
| Immigrants | Jordan | 93.1 /100 | #122 | Exceptional $57,145 |
| Slovenes | 93.1 /100 | #123 | Exceptional $57,145 |
| Chileans | 91.9 /100 | #124 | Exceptional $56,973 |
| Immigrants | Morocco | 91.8 /100 | #125 | Exceptional $56,958 |
| Chinese | 91.1 /100 | #126 | Exceptional $56,872 |
| Brazilians | 90.9 /100 | #127 | Exceptional $56,837 |
| Immigrants | Syria | 90.8 /100 | #128 | Exceptional $56,830 |
| Pakistanis | 89.9 /100 | #129 | Excellent $56,719 |
| Koreans | 89.4 /100 | #130 | Excellent $56,672 |
| Portuguese | 89.4 /100 | #131 | Excellent $56,663 |
| Czechs | 88.2 /100 | #132 | Excellent $56,546 |
| Immigrants | Germany | 88.2 /100 | #133 | Excellent $56,542 |
| Moroccans | 87.7 /100 | #134 | Excellent $56,499 |
Demographics Similar to Austrians by Median Male Earnings
In terms of median male earnings, the demographic groups most similar to Austrians are Laotian ($59,351, a difference of 0.010%), Immigrants from Moldova ($59,417, a difference of 0.10%), Immigrants from Kazakhstan ($59,278, a difference of 0.14%), Immigrants from Argentina ($59,491, a difference of 0.22%), and Immigrants from Southern Europe ($59,217, a difference of 0.24%).
| Demographics | Rating | Rank | Median Male Earnings |
| Immigrants | Italy | 99.4 /100 | #83 | Exceptional $59,691 |
| Afghans | 99.3 /100 | #84 | Exceptional $59,554 |
| Italians | 99.3 /100 | #85 | Exceptional $59,551 |
| Immigrants | England | 99.3 /100 | #86 | Exceptional $59,527 |
| Macedonians | 99.3 /100 | #87 | Exceptional $59,522 |
| Immigrants | Argentina | 99.3 /100 | #88 | Exceptional $59,491 |
| Immigrants | Moldova | 99.2 /100 | #89 | Exceptional $59,417 |
| Austrians | 99.2 /100 | #90 | Exceptional $59,359 |
| Laotians | 99.2 /100 | #91 | Exceptional $59,351 |
| Immigrants | Kazakhstan | 99.1 /100 | #92 | Exceptional $59,278 |
| Immigrants | Southern Europe | 99.0 /100 | #93 | Exceptional $59,217 |
| Immigrants | North Macedonia | 99.0 /100 | #94 | Exceptional $59,189 |
| Immigrants | Lebanon | 98.6 /100 | #95 | Exceptional $58,835 |
| Albanians | 98.4 /100 | #96 | Exceptional $58,680 |
| Northern Europeans | 98.2 /100 | #97 | Exceptional $58,588 |