Immigrants from Turkey vs Austrian Median Male Earnings
COMPARE
Immigrants from Turkey
Austrian
Median Male Earnings
Median Male Earnings Comparison
Immigrants from Turkey
Austrians
$62,728
MEDIAN MALE EARNINGS
100.0/ 100
METRIC RATING
41st/ 347
METRIC RANK
$59,359
MEDIAN MALE EARNINGS
99.2/ 100
METRIC RATING
90th/ 347
METRIC RANK
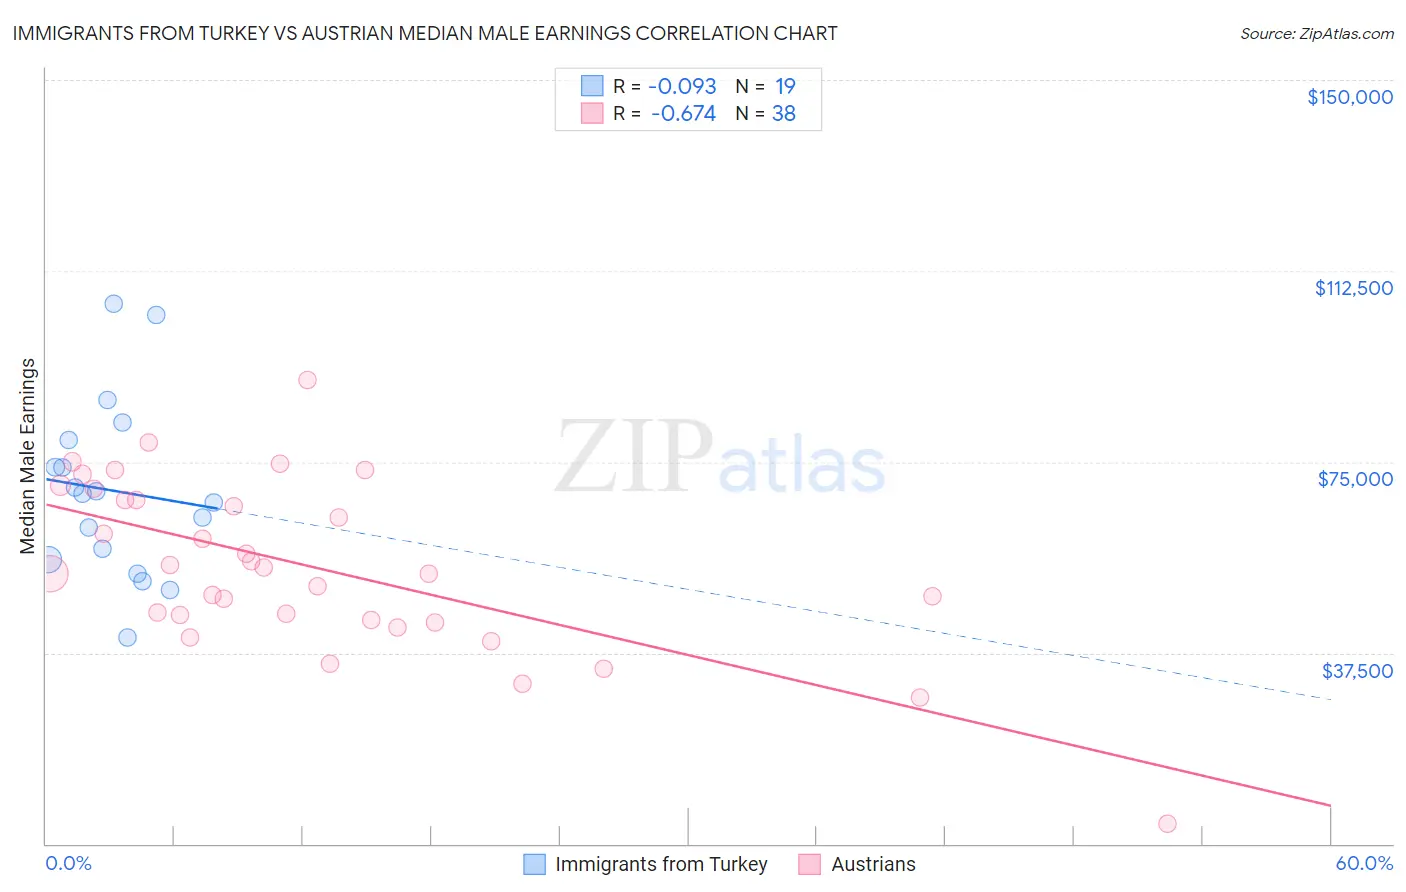
Immigrants from Turkey vs Austrian Median Male Earnings Correlation Chart
The statistical analysis conducted on geographies consisting of 223,034,216 people shows a slight negative correlation between the proportion of Immigrants from Turkey and median male earnings in the United States with a correlation coefficient (R) of -0.093 and weighted average of $62,728. Similarly, the statistical analysis conducted on geographies consisting of 451,854,520 people shows a significant negative correlation between the proportion of Austrians and median male earnings in the United States with a correlation coefficient (R) of -0.674 and weighted average of $59,359, a difference of 5.7%.
Median Male Earnings Correlation Summary
| Measurement | Immigrants from Turkey | Austrian |
| Minimum | $40,469 | $3,902 |
| Maximum | $106,104 | $91,143 |
| Range | $65,635 | $87,241 |
| Mean | $69,295 | $54,430 |
| Median | $68,821 | $53,632 |
| Interquartile 25% (IQ1) | $55,843 | $43,967 |
| Interquartile 75% (IQ3) | $79,397 | $67,629 |
| Interquartile Range (IQR) | $23,554 | $23,662 |
| Standard Deviation (Sample) | $17,281 | $16,958 |
| Standard Deviation (Population) | $16,820 | $16,734 |
Similar Demographics by Median Male Earnings
Demographics Similar to Immigrants from Turkey by Median Male Earnings
In terms of median male earnings, the demographic groups most similar to Immigrants from Turkey are Immigrants from Greece ($62,689, a difference of 0.060%), Immigrants from Belarus ($62,658, a difference of 0.11%), Australian ($62,857, a difference of 0.21%), Immigrants from South Africa ($62,899, a difference of 0.27%), and Cambodian ($62,516, a difference of 0.34%).
| Demographics | Rating | Rank | Median Male Earnings |
| Immigrants | Russia | 100.0 /100 | #34 | Exceptional $63,326 |
| Immigrants | Asia | 100.0 /100 | #35 | Exceptional $63,240 |
| Israelis | 100.0 /100 | #36 | Exceptional $63,228 |
| Immigrants | Sri Lanka | 100.0 /100 | #37 | Exceptional $63,099 |
| Maltese | 100.0 /100 | #38 | Exceptional $62,953 |
| Immigrants | South Africa | 100.0 /100 | #39 | Exceptional $62,899 |
| Australians | 100.0 /100 | #40 | Exceptional $62,857 |
| Immigrants | Turkey | 100.0 /100 | #41 | Exceptional $62,728 |
| Immigrants | Greece | 100.0 /100 | #42 | Exceptional $62,689 |
| Immigrants | Belarus | 100.0 /100 | #43 | Exceptional $62,658 |
| Cambodians | 100.0 /100 | #44 | Exceptional $62,516 |
| Bulgarians | 100.0 /100 | #45 | Exceptional $62,378 |
| Immigrants | Czechoslovakia | 99.9 /100 | #46 | Exceptional $62,217 |
| Immigrants | Austria | 99.9 /100 | #47 | Exceptional $62,164 |
| Immigrants | Malaysia | 99.9 /100 | #48 | Exceptional $62,121 |
Demographics Similar to Austrians by Median Male Earnings
In terms of median male earnings, the demographic groups most similar to Austrians are Laotian ($59,351, a difference of 0.010%), Immigrants from Moldova ($59,417, a difference of 0.10%), Immigrants from Kazakhstan ($59,278, a difference of 0.14%), Immigrants from Argentina ($59,491, a difference of 0.22%), and Immigrants from Southern Europe ($59,217, a difference of 0.24%).
| Demographics | Rating | Rank | Median Male Earnings |
| Immigrants | Italy | 99.4 /100 | #83 | Exceptional $59,691 |
| Afghans | 99.3 /100 | #84 | Exceptional $59,554 |
| Italians | 99.3 /100 | #85 | Exceptional $59,551 |
| Immigrants | England | 99.3 /100 | #86 | Exceptional $59,527 |
| Macedonians | 99.3 /100 | #87 | Exceptional $59,522 |
| Immigrants | Argentina | 99.3 /100 | #88 | Exceptional $59,491 |
| Immigrants | Moldova | 99.2 /100 | #89 | Exceptional $59,417 |
| Austrians | 99.2 /100 | #90 | Exceptional $59,359 |
| Laotians | 99.2 /100 | #91 | Exceptional $59,351 |
| Immigrants | Kazakhstan | 99.1 /100 | #92 | Exceptional $59,278 |
| Immigrants | Southern Europe | 99.0 /100 | #93 | Exceptional $59,217 |
| Immigrants | North Macedonia | 99.0 /100 | #94 | Exceptional $59,189 |
| Immigrants | Lebanon | 98.6 /100 | #95 | Exceptional $58,835 |
| Albanians | 98.4 /100 | #96 | Exceptional $58,680 |
| Northern Europeans | 98.2 /100 | #97 | Exceptional $58,588 |