Immigrants from Sudan vs Austrian Median Male Earnings
COMPARE
Immigrants from Sudan
Austrian
Median Male Earnings
Median Male Earnings Comparison
Immigrants from Sudan
Austrians
$51,489
MEDIAN MALE EARNINGS
5.0/ 100
METRIC RATING
225th/ 347
METRIC RANK
$59,359
MEDIAN MALE EARNINGS
99.2/ 100
METRIC RATING
90th/ 347
METRIC RANK
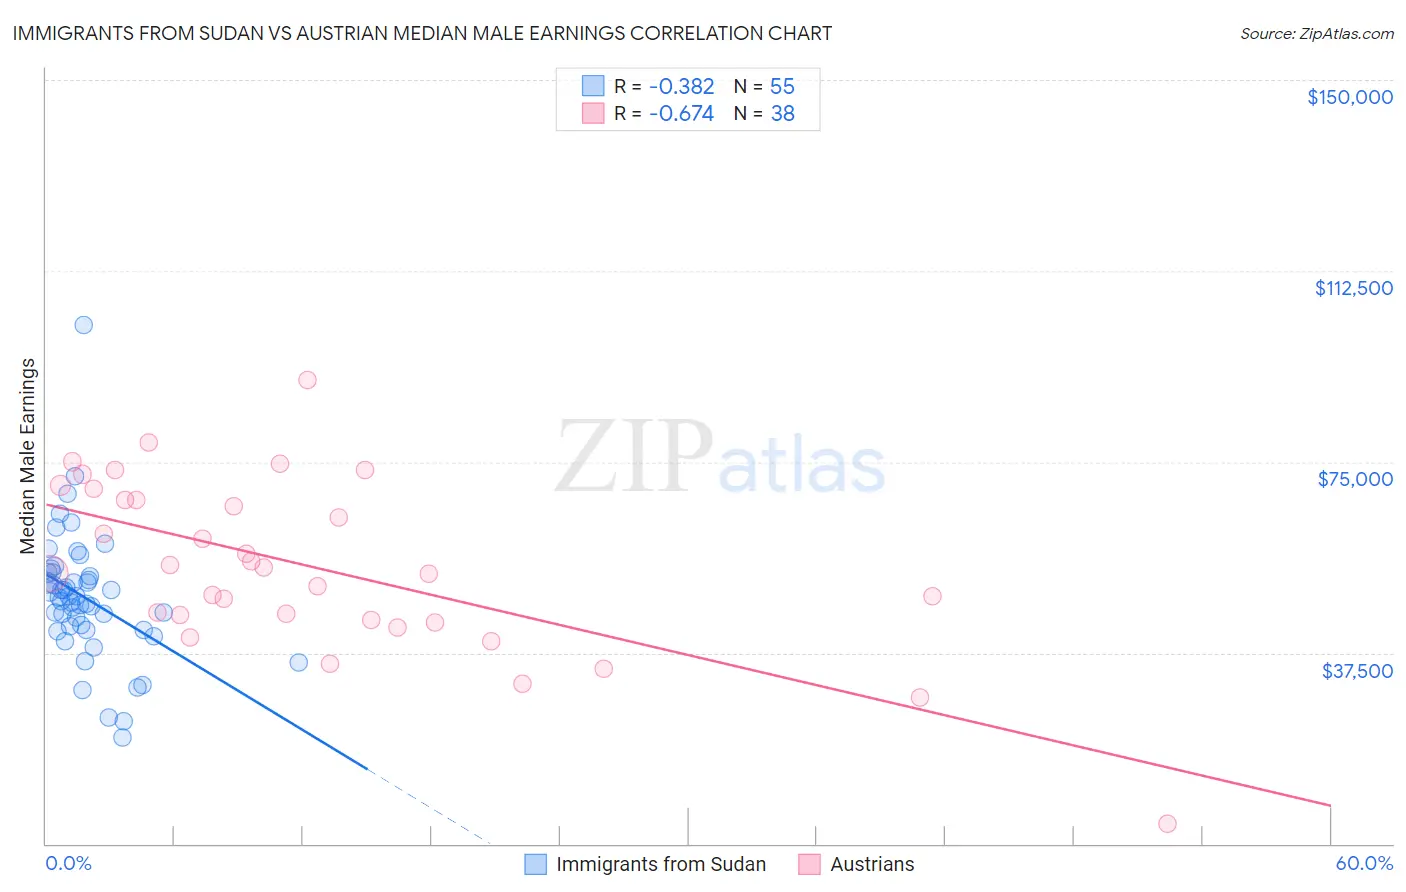
Immigrants from Sudan vs Austrian Median Male Earnings Correlation Chart
The statistical analysis conducted on geographies consisting of 118,955,444 people shows a mild negative correlation between the proportion of Immigrants from Sudan and median male earnings in the United States with a correlation coefficient (R) of -0.382 and weighted average of $51,489. Similarly, the statistical analysis conducted on geographies consisting of 451,854,520 people shows a significant negative correlation between the proportion of Austrians and median male earnings in the United States with a correlation coefficient (R) of -0.674 and weighted average of $59,359, a difference of 15.3%.
Median Male Earnings Correlation Summary
| Measurement | Immigrants from Sudan | Austrian |
| Minimum | $20,893 | $3,902 |
| Maximum | $101,789 | $91,143 |
| Range | $80,896 | $87,241 |
| Mean | $48,264 | $54,430 |
| Median | $48,306 | $53,632 |
| Interquartile 25% (IQ1) | $42,060 | $43,967 |
| Interquartile 75% (IQ3) | $53,241 | $67,629 |
| Interquartile Range (IQR) | $11,181 | $23,662 |
| Standard Deviation (Sample) | $12,693 | $16,958 |
| Standard Deviation (Population) | $12,577 | $16,734 |
Similar Demographics by Median Male Earnings
Demographics Similar to Immigrants from Sudan by Median Male Earnings
In terms of median male earnings, the demographic groups most similar to Immigrants from Sudan are Japanese ($51,473, a difference of 0.030%), Trinidadian and Tobagonian ($51,446, a difference of 0.080%), Samoan ($51,389, a difference of 0.19%), Immigrants from Cambodia ($51,594, a difference of 0.20%), and Ecuadorian ($51,596, a difference of 0.21%).
| Demographics | Rating | Rank | Median Male Earnings |
| Immigrants | Panama | 7.7 /100 | #218 | Tragic $51,962 |
| Immigrants | Ghana | 6.9 /100 | #219 | Tragic $51,836 |
| Immigrants | Armenia | 6.6 /100 | #220 | Tragic $51,793 |
| Immigrants | Senegal | 5.8 /100 | #221 | Tragic $51,647 |
| Immigrants | Bangladesh | 5.8 /100 | #222 | Tragic $51,642 |
| Ecuadorians | 5.5 /100 | #223 | Tragic $51,596 |
| Immigrants | Cambodia | 5.5 /100 | #224 | Tragic $51,594 |
| Immigrants | Sudan | 5.0 /100 | #225 | Tragic $51,489 |
| Japanese | 4.9 /100 | #226 | Tragic $51,473 |
| Trinidadians and Tobagonians | 4.8 /100 | #227 | Tragic $51,446 |
| Samoans | 4.6 /100 | #228 | Tragic $51,389 |
| Immigrants | Trinidad and Tobago | 4.5 /100 | #229 | Tragic $51,376 |
| Immigrants | Nigeria | 4.2 /100 | #230 | Tragic $51,310 |
| Barbadians | 3.9 /100 | #231 | Tragic $51,236 |
| Sudanese | 3.9 /100 | #232 | Tragic $51,216 |
Demographics Similar to Austrians by Median Male Earnings
In terms of median male earnings, the demographic groups most similar to Austrians are Laotian ($59,351, a difference of 0.010%), Immigrants from Moldova ($59,417, a difference of 0.10%), Immigrants from Kazakhstan ($59,278, a difference of 0.14%), Immigrants from Argentina ($59,491, a difference of 0.22%), and Immigrants from Southern Europe ($59,217, a difference of 0.24%).
| Demographics | Rating | Rank | Median Male Earnings |
| Immigrants | Italy | 99.4 /100 | #83 | Exceptional $59,691 |
| Afghans | 99.3 /100 | #84 | Exceptional $59,554 |
| Italians | 99.3 /100 | #85 | Exceptional $59,551 |
| Immigrants | England | 99.3 /100 | #86 | Exceptional $59,527 |
| Macedonians | 99.3 /100 | #87 | Exceptional $59,522 |
| Immigrants | Argentina | 99.3 /100 | #88 | Exceptional $59,491 |
| Immigrants | Moldova | 99.2 /100 | #89 | Exceptional $59,417 |
| Austrians | 99.2 /100 | #90 | Exceptional $59,359 |
| Laotians | 99.2 /100 | #91 | Exceptional $59,351 |
| Immigrants | Kazakhstan | 99.1 /100 | #92 | Exceptional $59,278 |
| Immigrants | Southern Europe | 99.0 /100 | #93 | Exceptional $59,217 |
| Immigrants | North Macedonia | 99.0 /100 | #94 | Exceptional $59,189 |
| Immigrants | Lebanon | 98.6 /100 | #95 | Exceptional $58,835 |
| Albanians | 98.4 /100 | #96 | Exceptional $58,680 |
| Northern Europeans | 98.2 /100 | #97 | Exceptional $58,588 |