Jordanian vs Austrian Median Male Earnings
COMPARE
Jordanian
Austrian
Median Male Earnings
Median Male Earnings Comparison
Jordanians
Austrians
$58,500
MEDIAN MALE EARNINGS
98.1/ 100
METRIC RATING
98th/ 347
METRIC RANK
$59,359
MEDIAN MALE EARNINGS
99.2/ 100
METRIC RATING
90th/ 347
METRIC RANK
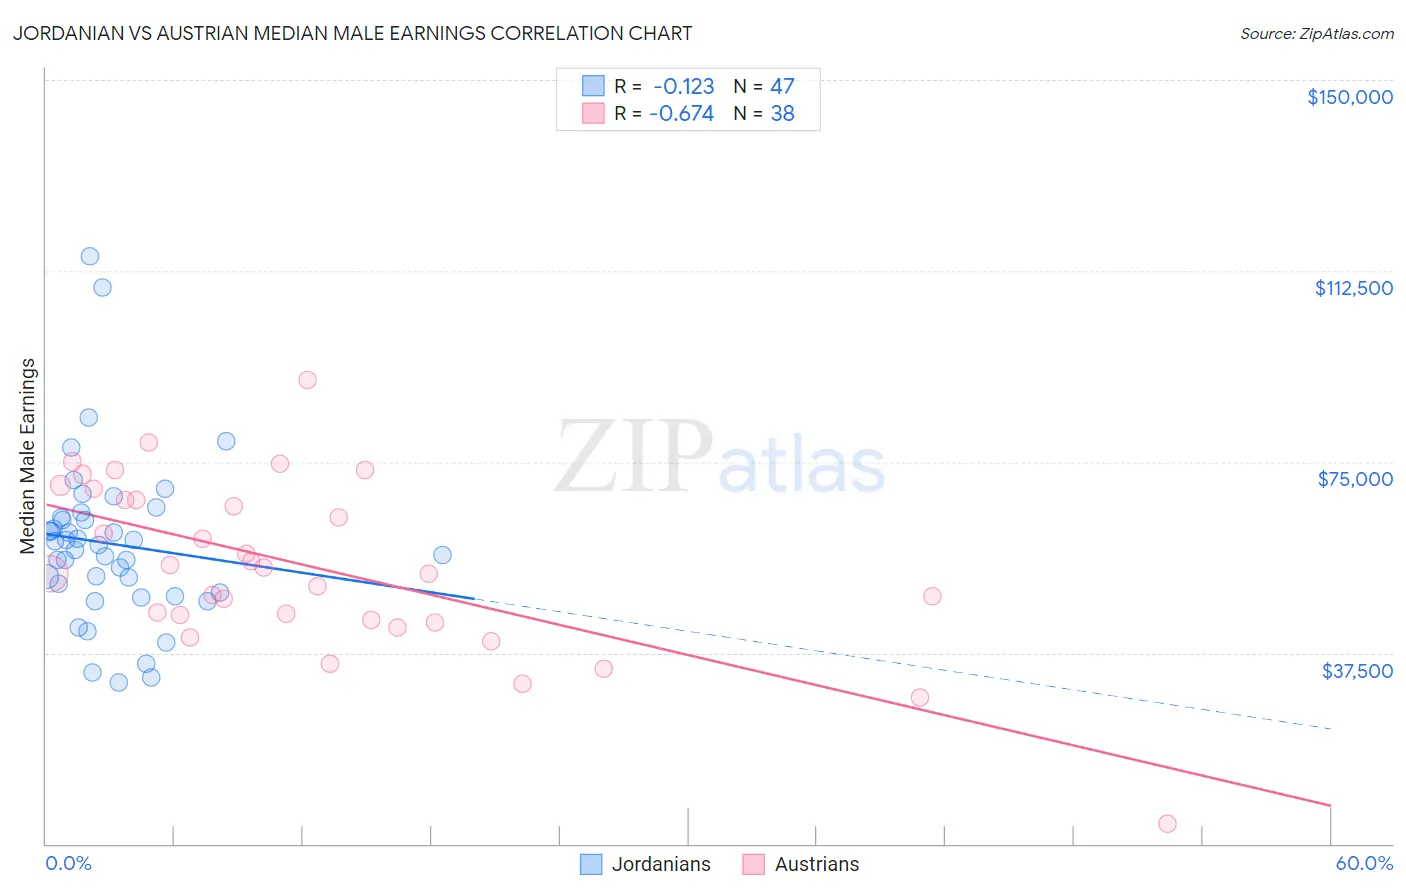
Jordanian vs Austrian Median Male Earnings Correlation Chart
The statistical analysis conducted on geographies consisting of 166,398,060 people shows a poor negative correlation between the proportion of Jordanians and median male earnings in the United States with a correlation coefficient (R) of -0.123 and weighted average of $58,500. Similarly, the statistical analysis conducted on geographies consisting of 451,854,520 people shows a significant negative correlation between the proportion of Austrians and median male earnings in the United States with a correlation coefficient (R) of -0.674 and weighted average of $59,359, a difference of 1.5%.
Median Male Earnings Correlation Summary
| Measurement | Jordanian | Austrian |
| Minimum | $31,660 | $3,902 |
| Maximum | $115,416 | $91,143 |
| Range | $83,756 | $87,241 |
| Mean | $58,929 | $54,430 |
| Median | $58,675 | $53,632 |
| Interquartile 25% (IQ1) | $49,250 | $43,967 |
| Interquartile 75% (IQ3) | $63,996 | $67,629 |
| Interquartile Range (IQR) | $14,746 | $23,662 |
| Standard Deviation (Sample) | $16,248 | $16,958 |
| Standard Deviation (Population) | $16,074 | $16,734 |
Demographics Similar to Jordanians and Austrians by Median Male Earnings
In terms of median male earnings, the demographic groups most similar to Jordanians are Immigrants from Poland ($58,452, a difference of 0.080%), Assyrian/Chaldean/Syriac ($58,437, a difference of 0.11%), Northern European ($58,588, a difference of 0.15%), Immigrants from Brazil ($58,324, a difference of 0.30%), and Albanian ($58,680, a difference of 0.31%). Similarly, the demographic groups most similar to Austrians are Laotian ($59,351, a difference of 0.010%), Immigrants from Moldova ($59,417, a difference of 0.10%), Immigrants from Kazakhstan ($59,278, a difference of 0.14%), Immigrants from Argentina ($59,491, a difference of 0.22%), and Immigrants from Southern Europe ($59,217, a difference of 0.24%).
| Demographics | Rating | Rank | Median Male Earnings |
| Afghans | 99.3 /100 | #84 | Exceptional $59,554 |
| Italians | 99.3 /100 | #85 | Exceptional $59,551 |
| Immigrants | England | 99.3 /100 | #86 | Exceptional $59,527 |
| Macedonians | 99.3 /100 | #87 | Exceptional $59,522 |
| Immigrants | Argentina | 99.3 /100 | #88 | Exceptional $59,491 |
| Immigrants | Moldova | 99.2 /100 | #89 | Exceptional $59,417 |
| Austrians | 99.2 /100 | #90 | Exceptional $59,359 |
| Laotians | 99.2 /100 | #91 | Exceptional $59,351 |
| Immigrants | Kazakhstan | 99.1 /100 | #92 | Exceptional $59,278 |
| Immigrants | Southern Europe | 99.0 /100 | #93 | Exceptional $59,217 |
| Immigrants | North Macedonia | 99.0 /100 | #94 | Exceptional $59,189 |
| Immigrants | Lebanon | 98.6 /100 | #95 | Exceptional $58,835 |
| Albanians | 98.4 /100 | #96 | Exceptional $58,680 |
| Northern Europeans | 98.2 /100 | #97 | Exceptional $58,588 |
| Jordanians | 98.1 /100 | #98 | Exceptional $58,500 |
| Immigrants | Poland | 98.0 /100 | #99 | Exceptional $58,452 |
| Assyrians/Chaldeans/Syriacs | 97.9 /100 | #100 | Exceptional $58,437 |
| Immigrants | Brazil | 97.7 /100 | #101 | Exceptional $58,324 |
| Syrians | 97.4 /100 | #102 | Exceptional $58,187 |
| Poles | 97.3 /100 | #103 | Exceptional $58,139 |
| Armenians | 97.3 /100 | #104 | Exceptional $58,134 |