Spaniard vs Immigrants from South Eastern Asia Median Earnings
COMPARE
Spaniard
Immigrants from South Eastern Asia
Median Earnings
Median Earnings Comparison
Spaniards
Immigrants from South Eastern Asia
$46,059
MEDIAN EARNINGS
37.2/ 100
METRIC RATING
189th/ 347
METRIC RANK
$47,671
MEDIAN EARNINGS
85.0/ 100
METRIC RATING
147th/ 347
METRIC RANK
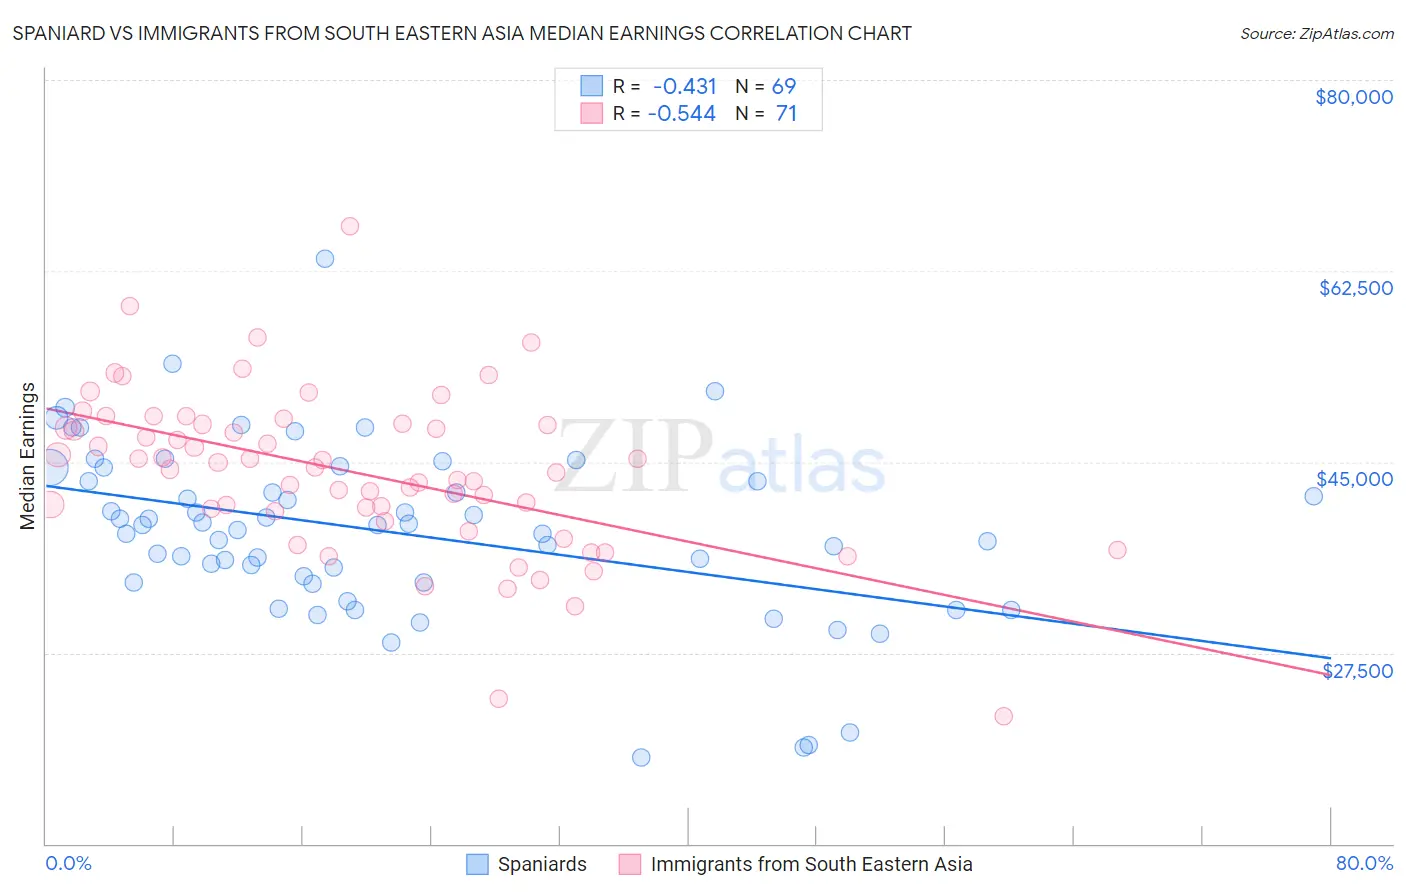
Spaniard vs Immigrants from South Eastern Asia Median Earnings Correlation Chart
The statistical analysis conducted on geographies consisting of 443,499,083 people shows a moderate negative correlation between the proportion of Spaniards and median earnings in the United States with a correlation coefficient (R) of -0.431 and weighted average of $46,059. Similarly, the statistical analysis conducted on geographies consisting of 512,554,349 people shows a substantial negative correlation between the proportion of Immigrants from South Eastern Asia and median earnings in the United States with a correlation coefficient (R) of -0.544 and weighted average of $47,671, a difference of 3.5%.
Median Earnings Correlation Summary
| Measurement | Spaniard | Immigrants from South Eastern Asia |
| Minimum | $17,955 | $21,667 |
| Maximum | $63,593 | $66,617 |
| Range | $45,638 | $44,950 |
| Mean | $38,549 | $44,037 |
| Median | $39,160 | $44,467 |
| Interquartile 25% (IQ1) | $33,928 | $40,525 |
| Interquartile 75% (IQ3) | $43,838 | $48,439 |
| Interquartile Range (IQR) | $9,909 | $7,914 |
| Standard Deviation (Sample) | $8,136 | $7,447 |
| Standard Deviation (Population) | $8,076 | $7,395 |
Similar Demographics by Median Earnings
Demographics Similar to Spaniards by Median Earnings
In terms of median earnings, the demographic groups most similar to Spaniards are French Canadian ($46,026, a difference of 0.070%), Immigrants from Armenia ($46,094, a difference of 0.080%), Iraqi ($46,140, a difference of 0.18%), Vietnamese ($46,172, a difference of 0.24%), and Finnish ($45,940, a difference of 0.26%).
| Demographics | Rating | Rank | Median Earnings |
| Swiss | 45.9 /100 | #182 | Average $46,315 |
| French | 45.2 /100 | #183 | Average $46,296 |
| Immigrants | Kenya | 42.4 /100 | #184 | Average $46,214 |
| Uruguayans | 41.6 /100 | #185 | Average $46,190 |
| Vietnamese | 40.9 /100 | #186 | Average $46,172 |
| Iraqis | 39.9 /100 | #187 | Fair $46,140 |
| Immigrants | Armenia | 38.3 /100 | #188 | Fair $46,094 |
| Spaniards | 37.2 /100 | #189 | Fair $46,059 |
| French Canadians | 36.1 /100 | #190 | Fair $46,026 |
| Finns | 33.4 /100 | #191 | Fair $45,940 |
| Germans | 33.2 /100 | #192 | Fair $45,935 |
| Guamanians/Chamorros | 33.2 /100 | #193 | Fair $45,933 |
| Immigrants | Costa Rica | 33.0 /100 | #194 | Fair $45,928 |
| Immigrants | St. Vincent and the Grenadines | 32.4 /100 | #195 | Fair $45,908 |
| Yugoslavians | 30.5 /100 | #196 | Fair $45,846 |
Demographics Similar to Immigrants from South Eastern Asia by Median Earnings
In terms of median earnings, the demographic groups most similar to Immigrants from South Eastern Asia are Immigrants from Eritrea ($47,657, a difference of 0.030%), Immigrants from Chile ($47,697, a difference of 0.060%), Luxembourger ($47,640, a difference of 0.060%), Immigrants from Saudi Arabia ($47,704, a difference of 0.070%), and Peruvian ($47,628, a difference of 0.090%).
| Demographics | Rating | Rank | Median Earnings |
| Taiwanese | 88.7 /100 | #140 | Excellent $47,902 |
| Immigrants | Sierra Leone | 88.3 /100 | #141 | Excellent $47,875 |
| Ugandans | 88.0 /100 | #142 | Excellent $47,854 |
| Swedes | 88.0 /100 | #143 | Excellent $47,851 |
| Hungarians | 87.1 /100 | #144 | Excellent $47,795 |
| Immigrants | Saudi Arabia | 85.6 /100 | #145 | Excellent $47,704 |
| Immigrants | Chile | 85.5 /100 | #146 | Excellent $47,697 |
| Immigrants | South Eastern Asia | 85.0 /100 | #147 | Excellent $47,671 |
| Immigrants | Eritrea | 84.8 /100 | #148 | Excellent $47,657 |
| Luxembourgers | 84.5 /100 | #149 | Excellent $47,640 |
| Peruvians | 84.2 /100 | #150 | Excellent $47,628 |
| Immigrants | Oceania | 84.1 /100 | #151 | Excellent $47,617 |
| Immigrants | Germany | 83.1 /100 | #152 | Excellent $47,566 |
| Slavs | 81.1 /100 | #153 | Excellent $47,470 |
| Immigrants | Portugal | 77.3 /100 | #154 | Good $47,304 |