Spaniard vs French American Indian Median Earnings
COMPARE
Spaniard
French American Indian
Median Earnings
Median Earnings Comparison
Spaniards
French American Indians
$46,059
MEDIAN EARNINGS
37.2/ 100
METRIC RATING
189th/ 347
METRIC RANK
$43,333
MEDIAN EARNINGS
1.3/ 100
METRIC RATING
258th/ 347
METRIC RANK
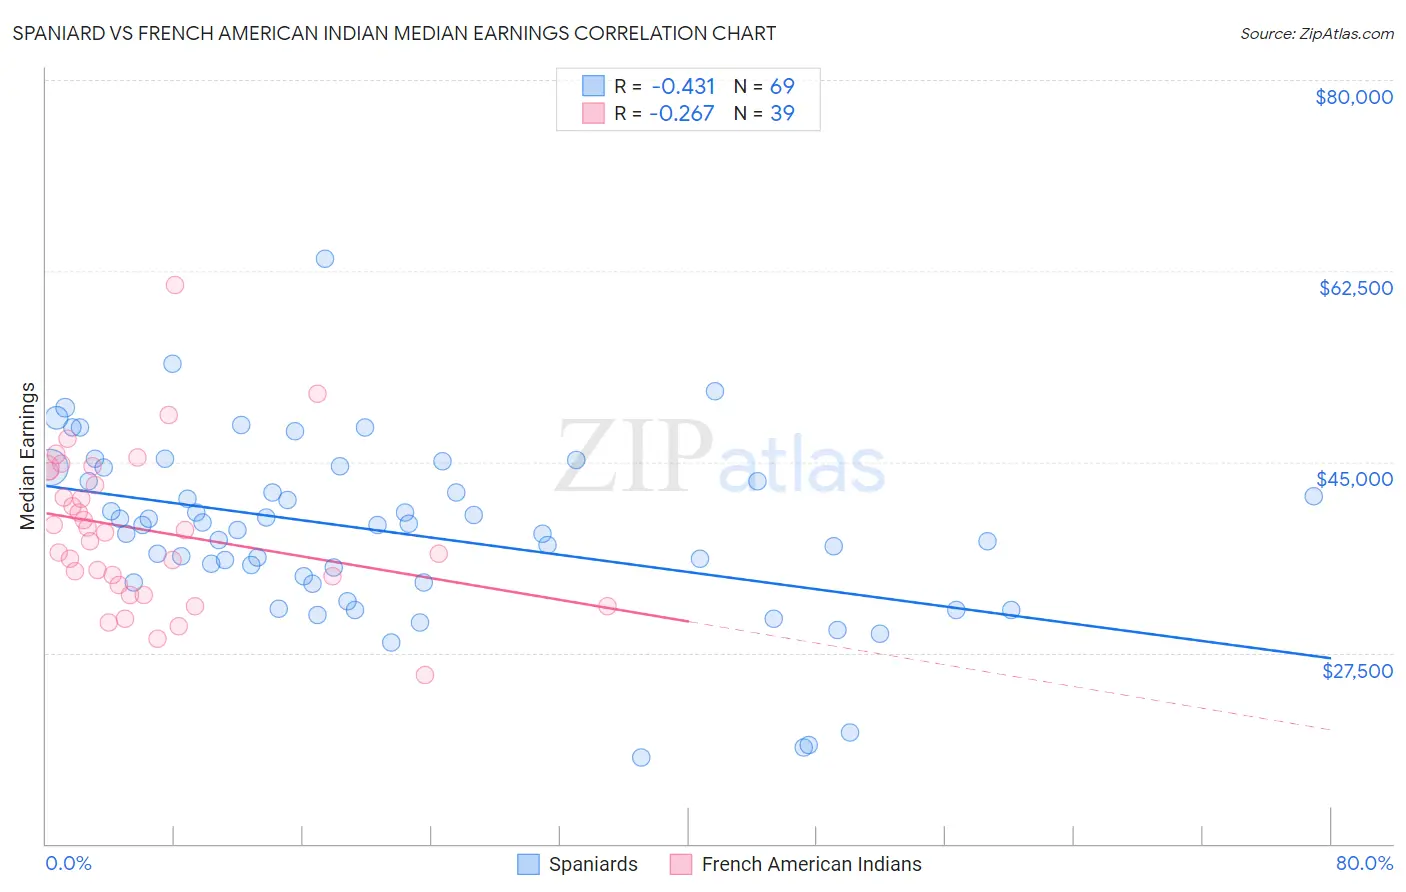
Spaniard vs French American Indian Median Earnings Correlation Chart
The statistical analysis conducted on geographies consisting of 443,499,083 people shows a moderate negative correlation between the proportion of Spaniards and median earnings in the United States with a correlation coefficient (R) of -0.431 and weighted average of $46,059. Similarly, the statistical analysis conducted on geographies consisting of 131,971,536 people shows a weak negative correlation between the proportion of French American Indians and median earnings in the United States with a correlation coefficient (R) of -0.267 and weighted average of $43,333, a difference of 6.3%.
Median Earnings Correlation Summary
| Measurement | Spaniard | French American Indian |
| Minimum | $17,955 | $25,417 |
| Maximum | $63,593 | $61,250 |
| Range | $45,638 | $35,833 |
| Mean | $38,549 | $38,746 |
| Median | $39,160 | $38,517 |
| Interquartile 25% (IQ1) | $33,928 | $33,745 |
| Interquartile 75% (IQ3) | $43,838 | $44,112 |
| Interquartile Range (IQR) | $9,909 | $10,368 |
| Standard Deviation (Sample) | $8,136 | $7,041 |
| Standard Deviation (Population) | $8,076 | $6,950 |
Similar Demographics by Median Earnings
Demographics Similar to Spaniards by Median Earnings
In terms of median earnings, the demographic groups most similar to Spaniards are French Canadian ($46,026, a difference of 0.070%), Immigrants from Armenia ($46,094, a difference of 0.080%), Iraqi ($46,140, a difference of 0.18%), Vietnamese ($46,172, a difference of 0.24%), and Finnish ($45,940, a difference of 0.26%).
| Demographics | Rating | Rank | Median Earnings |
| Swiss | 45.9 /100 | #182 | Average $46,315 |
| French | 45.2 /100 | #183 | Average $46,296 |
| Immigrants | Kenya | 42.4 /100 | #184 | Average $46,214 |
| Uruguayans | 41.6 /100 | #185 | Average $46,190 |
| Vietnamese | 40.9 /100 | #186 | Average $46,172 |
| Iraqis | 39.9 /100 | #187 | Fair $46,140 |
| Immigrants | Armenia | 38.3 /100 | #188 | Fair $46,094 |
| Spaniards | 37.2 /100 | #189 | Fair $46,059 |
| French Canadians | 36.1 /100 | #190 | Fair $46,026 |
| Finns | 33.4 /100 | #191 | Fair $45,940 |
| Germans | 33.2 /100 | #192 | Fair $45,935 |
| Guamanians/Chamorros | 33.2 /100 | #193 | Fair $45,933 |
| Immigrants | Costa Rica | 33.0 /100 | #194 | Fair $45,928 |
| Immigrants | St. Vincent and the Grenadines | 32.4 /100 | #195 | Fair $45,908 |
| Yugoslavians | 30.5 /100 | #196 | Fair $45,846 |
Demographics Similar to French American Indians by Median Earnings
In terms of median earnings, the demographic groups most similar to French American Indians are Jamaican ($43,343, a difference of 0.020%), Alaskan Athabascan ($43,393, a difference of 0.14%), Immigrants from Middle Africa ($43,416, a difference of 0.19%), German Russian ($43,200, a difference of 0.31%), and Liberian ($43,536, a difference of 0.47%).
| Demographics | Rating | Rank | Median Earnings |
| Tsimshian | 2.1 /100 | #251 | Tragic $43,695 |
| Hawaiians | 2.0 /100 | #252 | Tragic $43,673 |
| Somalis | 1.8 /100 | #253 | Tragic $43,567 |
| Liberians | 1.7 /100 | #254 | Tragic $43,536 |
| Immigrants | Middle Africa | 1.4 /100 | #255 | Tragic $43,416 |
| Alaskan Athabascans | 1.4 /100 | #256 | Tragic $43,393 |
| Jamaicans | 1.3 /100 | #257 | Tragic $43,343 |
| French American Indians | 1.3 /100 | #258 | Tragic $43,333 |
| German Russians | 1.1 /100 | #259 | Tragic $43,200 |
| Immigrants | Somalia | 0.9 /100 | #260 | Tragic $43,100 |
| Immigrants | Jamaica | 0.8 /100 | #261 | Tragic $43,026 |
| Nicaraguans | 0.8 /100 | #262 | Tragic $43,026 |
| Inupiat | 0.8 /100 | #263 | Tragic $43,000 |
| Immigrants | Liberia | 0.7 /100 | #264 | Tragic $42,923 |
| Salvadorans | 0.7 /100 | #265 | Tragic $42,912 |