Spaniard vs Dutch Median Earnings
COMPARE
Spaniard
Dutch
Median Earnings
Median Earnings Comparison
Spaniards
Dutch
$46,059
MEDIAN EARNINGS
37.2/ 100
METRIC RATING
189th/ 347
METRIC RANK
$45,370
MEDIAN EARNINGS
18.4/ 100
METRIC RATING
219th/ 347
METRIC RANK
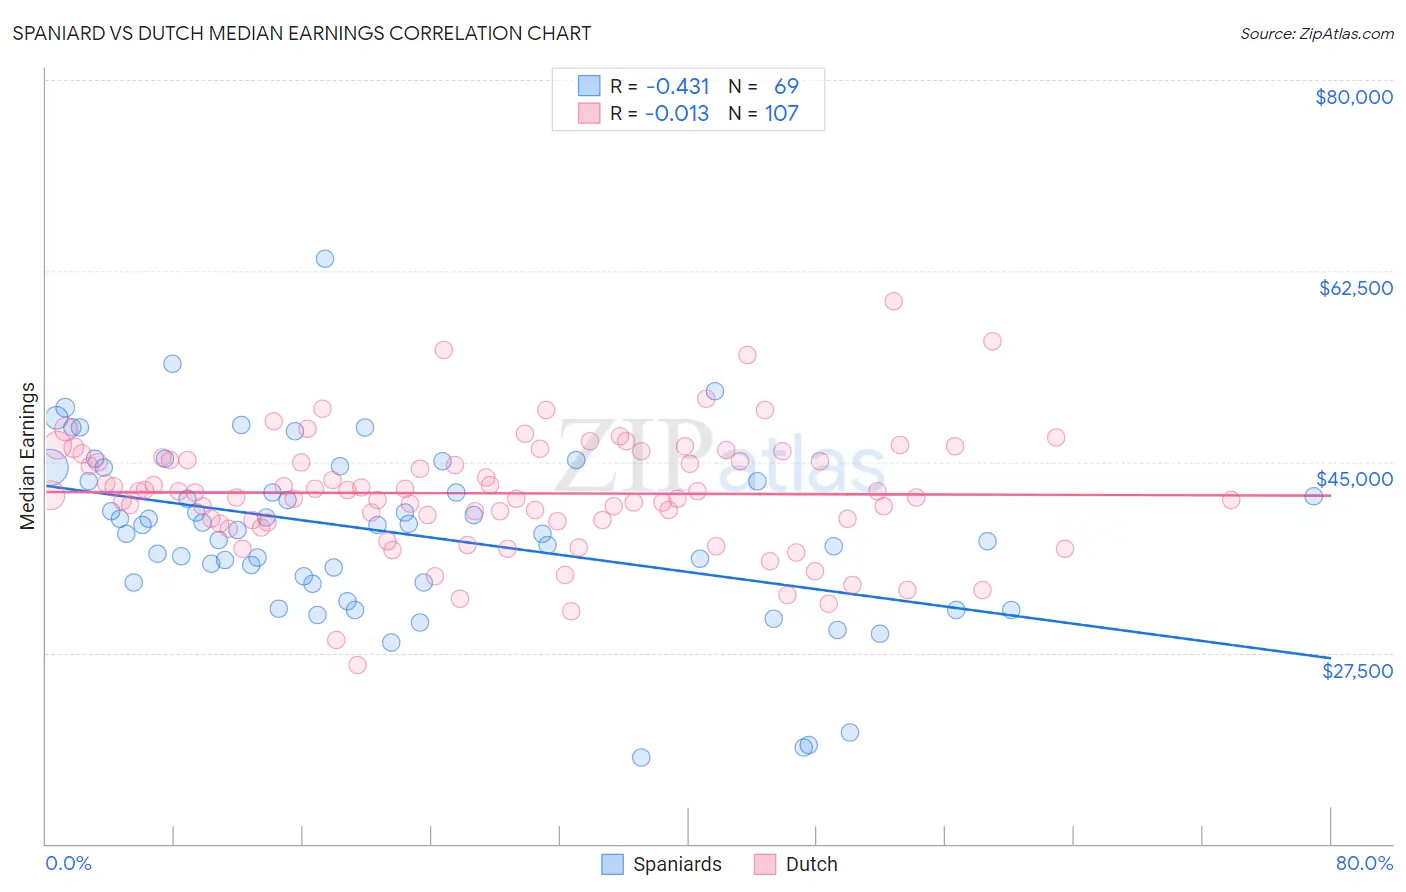
Spaniard vs Dutch Median Earnings Correlation Chart
The statistical analysis conducted on geographies consisting of 443,499,083 people shows a moderate negative correlation between the proportion of Spaniards and median earnings in the United States with a correlation coefficient (R) of -0.431 and weighted average of $46,059. Similarly, the statistical analysis conducted on geographies consisting of 554,077,686 people shows no correlation between the proportion of Dutch and median earnings in the United States with a correlation coefficient (R) of -0.013 and weighted average of $45,370, a difference of 1.5%.
Median Earnings Correlation Summary
| Measurement | Spaniard | Dutch |
| Minimum | $17,955 | $26,401 |
| Maximum | $63,593 | $59,776 |
| Range | $45,638 | $33,374 |
| Mean | $38,549 | $42,124 |
| Median | $39,160 | $42,201 |
| Interquartile 25% (IQ1) | $33,928 | $39,612 |
| Interquartile 75% (IQ3) | $43,838 | $45,450 |
| Interquartile Range (IQR) | $9,909 | $5,838 |
| Standard Deviation (Sample) | $8,136 | $5,476 |
| Standard Deviation (Population) | $8,076 | $5,450 |
Similar Demographics by Median Earnings
Demographics Similar to Spaniards by Median Earnings
In terms of median earnings, the demographic groups most similar to Spaniards are French Canadian ($46,026, a difference of 0.070%), Immigrants from Armenia ($46,094, a difference of 0.080%), Iraqi ($46,140, a difference of 0.18%), Vietnamese ($46,172, a difference of 0.24%), and Finnish ($45,940, a difference of 0.26%).
| Demographics | Rating | Rank | Median Earnings |
| Swiss | 45.9 /100 | #182 | Average $46,315 |
| French | 45.2 /100 | #183 | Average $46,296 |
| Immigrants | Kenya | 42.4 /100 | #184 | Average $46,214 |
| Uruguayans | 41.6 /100 | #185 | Average $46,190 |
| Vietnamese | 40.9 /100 | #186 | Average $46,172 |
| Iraqis | 39.9 /100 | #187 | Fair $46,140 |
| Immigrants | Armenia | 38.3 /100 | #188 | Fair $46,094 |
| Spaniards | 37.2 /100 | #189 | Fair $46,059 |
| French Canadians | 36.1 /100 | #190 | Fair $46,026 |
| Finns | 33.4 /100 | #191 | Fair $45,940 |
| Germans | 33.2 /100 | #192 | Fair $45,935 |
| Guamanians/Chamorros | 33.2 /100 | #193 | Fair $45,933 |
| Immigrants | Costa Rica | 33.0 /100 | #194 | Fair $45,928 |
| Immigrants | St. Vincent and the Grenadines | 32.4 /100 | #195 | Fair $45,908 |
| Yugoslavians | 30.5 /100 | #196 | Fair $45,846 |
Demographics Similar to Dutch by Median Earnings
In terms of median earnings, the demographic groups most similar to Dutch are Spanish ($45,432, a difference of 0.14%), Guyanese ($45,470, a difference of 0.22%), Tlingit-Haida ($45,468, a difference of 0.22%), Ecuadorian ($45,214, a difference of 0.35%), and Nigerian ($45,532, a difference of 0.36%).
| Demographics | Rating | Rank | Median Earnings |
| Bermudans | 23.5 /100 | #212 | Fair $45,593 |
| Immigrants | Colombia | 22.4 /100 | #213 | Fair $45,550 |
| Nigerians | 22.0 /100 | #214 | Fair $45,532 |
| Immigrants | Bangladesh | 22.0 /100 | #215 | Fair $45,532 |
| Guyanese | 20.6 /100 | #216 | Fair $45,470 |
| Tlingit-Haida | 20.5 /100 | #217 | Fair $45,468 |
| Spanish | 19.7 /100 | #218 | Poor $45,432 |
| Dutch | 18.4 /100 | #219 | Poor $45,370 |
| Ecuadorians | 15.3 /100 | #220 | Poor $45,214 |
| Immigrants | Guyana | 15.1 /100 | #221 | Poor $45,204 |
| Immigrants | Panama | 15.0 /100 | #222 | Poor $45,198 |
| Whites/Caucasians | 15.0 /100 | #223 | Poor $45,197 |
| West Indians | 13.9 /100 | #224 | Poor $45,132 |
| Immigrants | Cambodia | 13.2 /100 | #225 | Poor $45,090 |
| Immigrants | Nigeria | 12.2 /100 | #226 | Poor $45,030 |