Spaniard vs Immigrants from Nepal Seniors Poverty Over the Age of 65
COMPARE
Spaniard
Immigrants from Nepal
Seniors Poverty Over the Age of 65
Seniors Poverty Over the Age of 65 Comparison
Spaniards
Immigrants from Nepal
10.9%
SENIORS POVERTY OVER THE AGE OF 65
50.7/ 100
METRIC RATING
173rd/ 347
METRIC RANK
10.1%
SENIORS POVERTY OVER THE AGE OF 65
97.2/ 100
METRIC RATING
85th/ 347
METRIC RANK
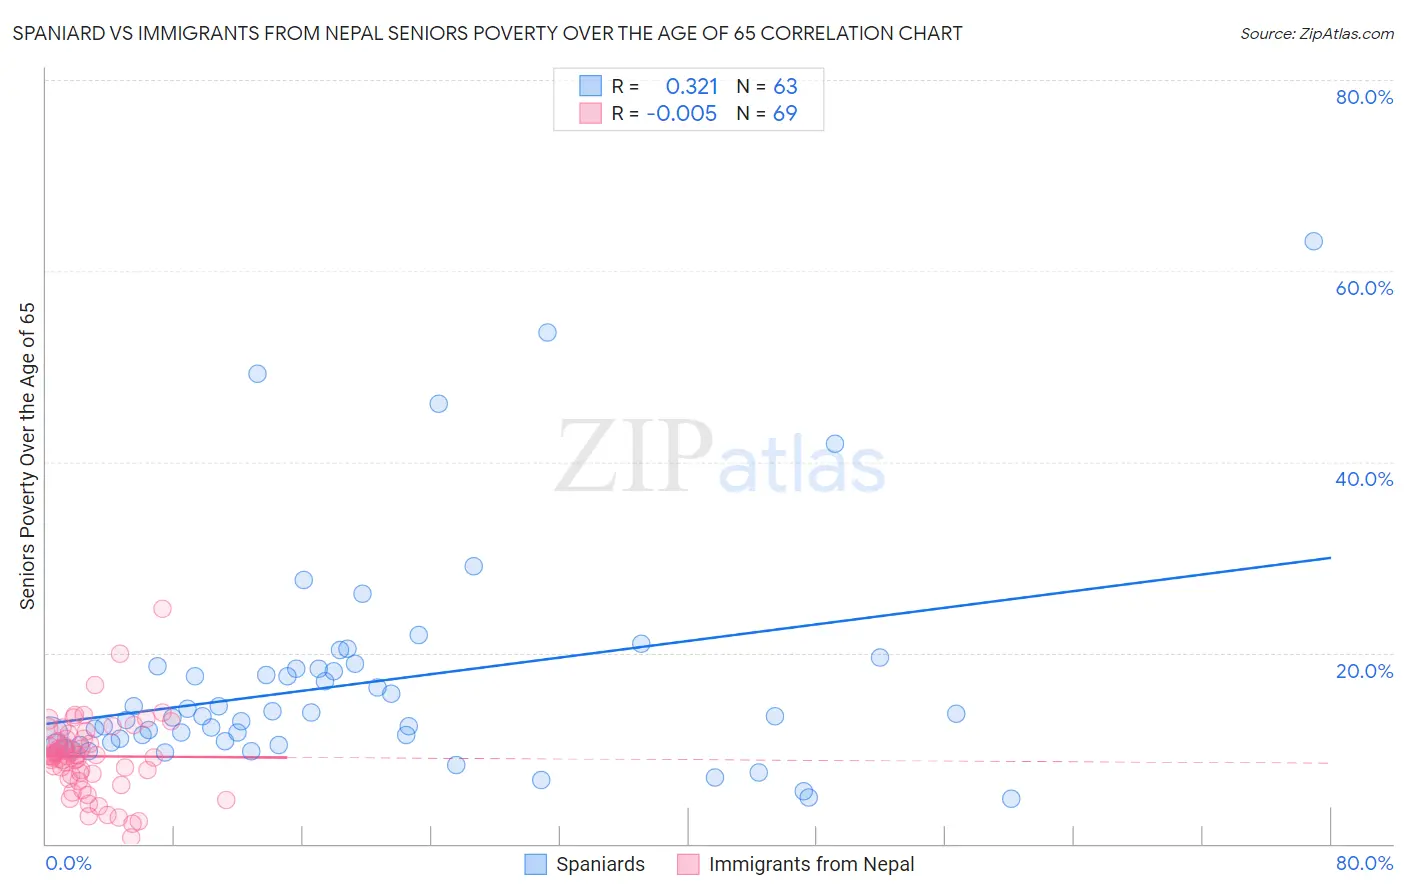
Spaniard vs Immigrants from Nepal Seniors Poverty Over the Age of 65 Correlation Chart
The statistical analysis conducted on geographies consisting of 441,385,705 people shows a mild positive correlation between the proportion of Spaniards and poverty level among seniors over the age of 65 in the United States with a correlation coefficient (R) of 0.321 and weighted average of 10.9%. Similarly, the statistical analysis conducted on geographies consisting of 186,290,028 people shows no correlation between the proportion of Immigrants from Nepal and poverty level among seniors over the age of 65 in the United States with a correlation coefficient (R) of -0.005 and weighted average of 10.1%, a difference of 8.5%.
Seniors Poverty Over the Age of 65 Correlation Summary
| Measurement | Spaniard | Immigrants from Nepal |
| Minimum | 4.7% | 0.71% |
| Maximum | 63.2% | 24.6% |
| Range | 58.4% | 23.8% |
| Mean | 16.8% | 9.2% |
| Median | 13.4% | 9.2% |
| Interquartile 25% (IQ1) | 10.5% | 7.3% |
| Interquartile 75% (IQ3) | 18.4% | 11.0% |
| Interquartile Range (IQR) | 7.8% | 3.7% |
| Standard Deviation (Sample) | 11.4% | 3.9% |
| Standard Deviation (Population) | 11.4% | 3.9% |
Similar Demographics by Seniors Poverty Over the Age of 65
Demographics Similar to Spaniards by Seniors Poverty Over the Age of 65
In terms of seniors poverty over the age of 65, the demographic groups most similar to Spaniards are Immigrants from Sudan (10.9%, a difference of 0.070%), Creek (10.9%, a difference of 0.10%), Immigrants from Malaysia (11.0%, a difference of 0.25%), Cherokee (11.0%, a difference of 0.30%), and German Russian (11.0%, a difference of 0.34%).
| Demographics | Rating | Rank | Seniors Poverty Over the Age of 65 |
| Malaysians | 62.0 /100 | #166 | Good 10.8% |
| Alaska Natives | 60.3 /100 | #167 | Good 10.8% |
| Mongolians | 58.0 /100 | #168 | Average 10.9% |
| Sri Lankans | 56.8 /100 | #169 | Average 10.9% |
| Immigrants | Eastern Europe | 55.8 /100 | #170 | Average 10.9% |
| Immigrants | Nonimmigrants | 55.1 /100 | #171 | Average 10.9% |
| Immigrants | Syria | 54.7 /100 | #172 | Average 10.9% |
| Spaniards | 50.7 /100 | #173 | Average 10.9% |
| Immigrants | Sudan | 50.0 /100 | #174 | Average 10.9% |
| Creek | 49.6 /100 | #175 | Average 10.9% |
| Immigrants | Malaysia | 47.9 /100 | #176 | Average 11.0% |
| Cherokee | 47.3 /100 | #177 | Average 11.0% |
| German Russians | 46.9 /100 | #178 | Average 11.0% |
| Immigrants | Northern Africa | 44.6 /100 | #179 | Average 11.0% |
| Immigrants | Thailand | 43.5 /100 | #180 | Average 11.0% |
Demographics Similar to Immigrants from Nepal by Seniors Poverty Over the Age of 65
In terms of seniors poverty over the age of 65, the demographic groups most similar to Immigrants from Nepal are Immigrants from Afghanistan (10.1%, a difference of 0.0%), Romanian (10.1%, a difference of 0.020%), Immigrants from Poland (10.1%, a difference of 0.030%), Burmese (10.1%, a difference of 0.040%), and Immigrants from Bolivia (10.1%, a difference of 0.060%).
| Demographics | Rating | Rank | Seniors Poverty Over the Age of 65 |
| Whites/Caucasians | 97.5 /100 | #78 | Exceptional 10.0% |
| Immigrants | Ireland | 97.5 /100 | #79 | Exceptional 10.0% |
| Koreans | 97.4 /100 | #80 | Exceptional 10.1% |
| Immigrants | Sri Lanka | 97.3 /100 | #81 | Exceptional 10.1% |
| Immigrants | Bolivia | 97.3 /100 | #82 | Exceptional 10.1% |
| Immigrants | Poland | 97.2 /100 | #83 | Exceptional 10.1% |
| Immigrants | Afghanistan | 97.2 /100 | #84 | Exceptional 10.1% |
| Immigrants | Nepal | 97.2 /100 | #85 | Exceptional 10.1% |
| Romanians | 97.2 /100 | #86 | Exceptional 10.1% |
| Burmese | 97.2 /100 | #87 | Exceptional 10.1% |
| Jordanians | 97.1 /100 | #88 | Exceptional 10.1% |
| Immigrants | Bulgaria | 97.0 /100 | #89 | Exceptional 10.1% |
| Ukrainians | 96.9 /100 | #90 | Exceptional 10.1% |
| Puget Sound Salish | 96.9 /100 | #91 | Exceptional 10.1% |
| Immigrants | Singapore | 96.9 /100 | #92 | Exceptional 10.1% |