Immigrants from Russia vs Immigrants from Nepal Per Capita Income
COMPARE
Immigrants from Russia
Immigrants from Nepal
Per Capita Income
Per Capita Income Comparison
Immigrants from Russia
Immigrants from Nepal
$52,044
PER CAPITA INCOME
100.0/ 100
METRIC RATING
34th/ 347
METRIC RANK
$44,187
PER CAPITA INCOME
64.3/ 100
METRIC RATING
158th/ 347
METRIC RANK
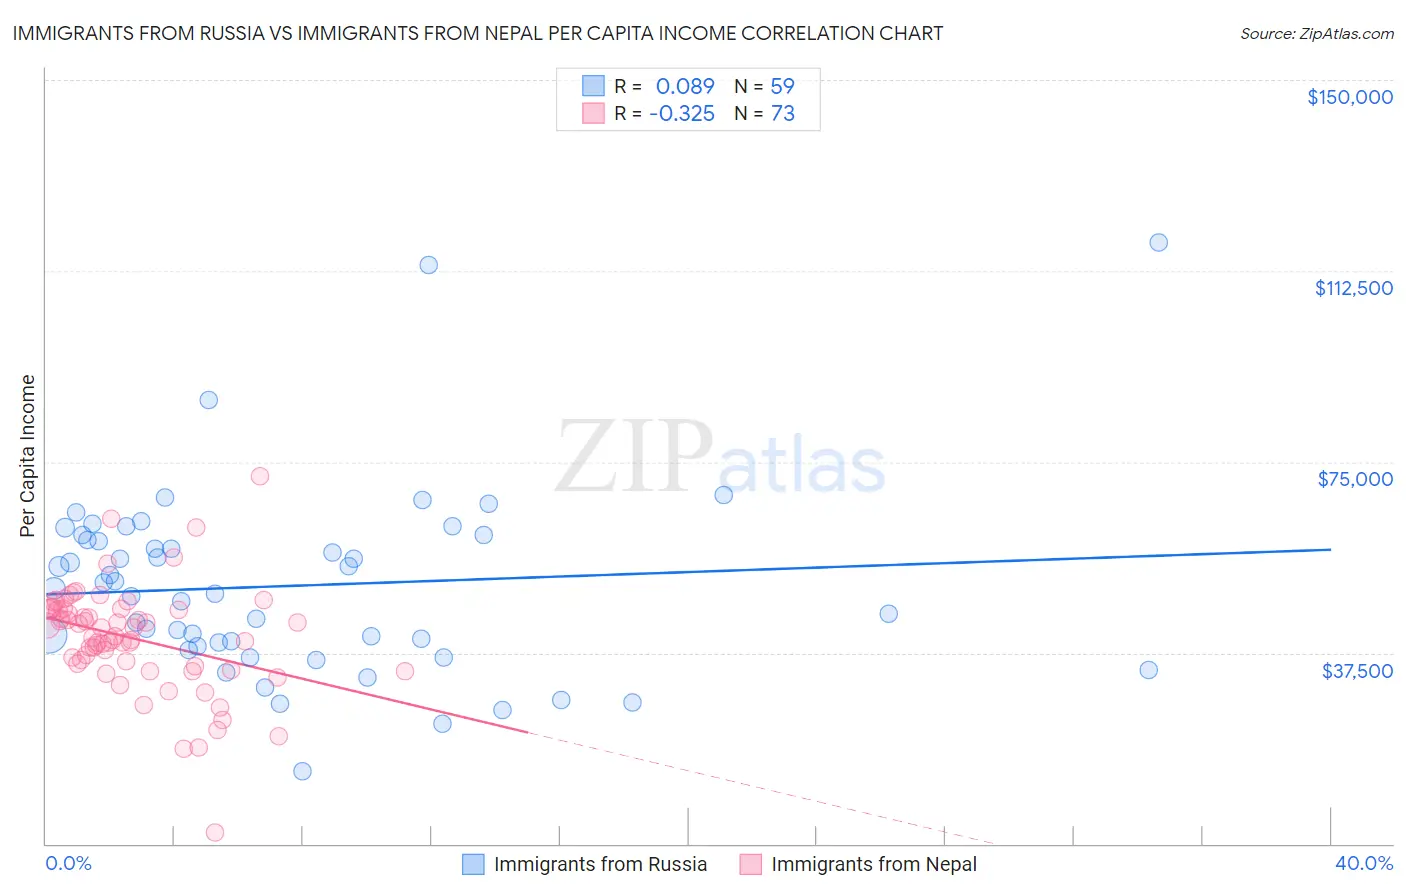
Immigrants from Russia vs Immigrants from Nepal Per Capita Income Correlation Chart
The statistical analysis conducted on geographies consisting of 347,969,054 people shows a slight positive correlation between the proportion of Immigrants from Russia and per capita income in the United States with a correlation coefficient (R) of 0.089 and weighted average of $52,044. Similarly, the statistical analysis conducted on geographies consisting of 186,792,214 people shows a mild negative correlation between the proportion of Immigrants from Nepal and per capita income in the United States with a correlation coefficient (R) of -0.325 and weighted average of $44,187, a difference of 17.8%.
Per Capita Income Correlation Summary
| Measurement | Immigrants from Russia | Immigrants from Nepal |
| Minimum | $14,227 | $2,302 |
| Maximum | $118,015 | $72,138 |
| Range | $103,788 | $69,836 |
| Mean | $50,649 | $40,351 |
| Median | $50,146 | $40,773 |
| Interquartile 25% (IQ1) | $38,836 | $35,186 |
| Interquartile 75% (IQ3) | $60,540 | $46,005 |
| Interquartile Range (IQR) | $21,704 | $10,819 |
| Standard Deviation (Sample) | $18,532 | $10,460 |
| Standard Deviation (Population) | $18,374 | $10,388 |
Similar Demographics by Per Capita Income
Demographics Similar to Immigrants from Russia by Per Capita Income
In terms of per capita income, the demographic groups most similar to Immigrants from Russia are Australian ($52,074, a difference of 0.060%), Burmese ($52,005, a difference of 0.070%), Immigrants from Greece ($51,891, a difference of 0.29%), Immigrants from Norway ($52,217, a difference of 0.33%), and Estonian ($51,875, a difference of 0.33%).
| Demographics | Rating | Rank | Per Capita Income |
| Immigrants | South Central Asia | 100.0 /100 | #27 | Exceptional $52,660 |
| Latvians | 100.0 /100 | #28 | Exceptional $52,649 |
| Israelis | 100.0 /100 | #29 | Exceptional $52,596 |
| Immigrants | Austria | 100.0 /100 | #30 | Exceptional $52,503 |
| Turks | 100.0 /100 | #31 | Exceptional $52,391 |
| Immigrants | Norway | 100.0 /100 | #32 | Exceptional $52,217 |
| Australians | 100.0 /100 | #33 | Exceptional $52,074 |
| Immigrants | Russia | 100.0 /100 | #34 | Exceptional $52,044 |
| Burmese | 100.0 /100 | #35 | Exceptional $52,005 |
| Immigrants | Greece | 100.0 /100 | #36 | Exceptional $51,891 |
| Estonians | 100.0 /100 | #37 | Exceptional $51,875 |
| Immigrants | Czechoslovakia | 100.0 /100 | #38 | Exceptional $51,770 |
| Cambodians | 100.0 /100 | #39 | Exceptional $51,731 |
| Immigrants | Korea | 100.0 /100 | #40 | Exceptional $51,671 |
| Immigrants | South Africa | 100.0 /100 | #41 | Exceptional $51,465 |
Demographics Similar to Immigrants from Nepal by Per Capita Income
In terms of per capita income, the demographic groups most similar to Immigrants from Nepal are South American Indian ($44,206, a difference of 0.040%), Slovak ($44,229, a difference of 0.090%), South American ($44,114, a difference of 0.17%), Danish ($44,095, a difference of 0.21%), and Costa Rican ($44,090, a difference of 0.22%).
| Demographics | Rating | Rank | Per Capita Income |
| Norwegians | 71.5 /100 | #151 | Good $44,480 |
| Peruvians | 71.5 /100 | #152 | Good $44,479 |
| Scottish | 70.6 /100 | #153 | Good $44,440 |
| Portuguese | 68.7 /100 | #154 | Good $44,362 |
| Uruguayans | 67.6 /100 | #155 | Good $44,318 |
| Slovaks | 65.4 /100 | #156 | Good $44,229 |
| South American Indians | 64.8 /100 | #157 | Good $44,206 |
| Immigrants | Nepal | 64.3 /100 | #158 | Good $44,187 |
| South Americans | 62.4 /100 | #159 | Good $44,114 |
| Danes | 61.9 /100 | #160 | Good $44,095 |
| Costa Ricans | 61.8 /100 | #161 | Good $44,090 |
| Swiss | 61.4 /100 | #162 | Good $44,076 |
| Immigrants | South America | 61.2 /100 | #163 | Good $44,068 |
| Sri Lankans | 59.8 /100 | #164 | Average $44,014 |
| Immigrants | Philippines | 59.4 /100 | #165 | Average $44,000 |