Yup'ik vs Alaska Native Median Female Earnings
COMPARE
Yup'ik
Alaska Native
Median Female Earnings
Median Female Earnings Comparison
Yup'ik
Alaska Natives
$32,730
MEDIAN FEMALE EARNINGS
0.0/ 100
METRIC RATING
342nd/ 347
METRIC RANK
$38,202
MEDIAN FEMALE EARNINGS
4.3/ 100
METRIC RATING
238th/ 347
METRIC RANK
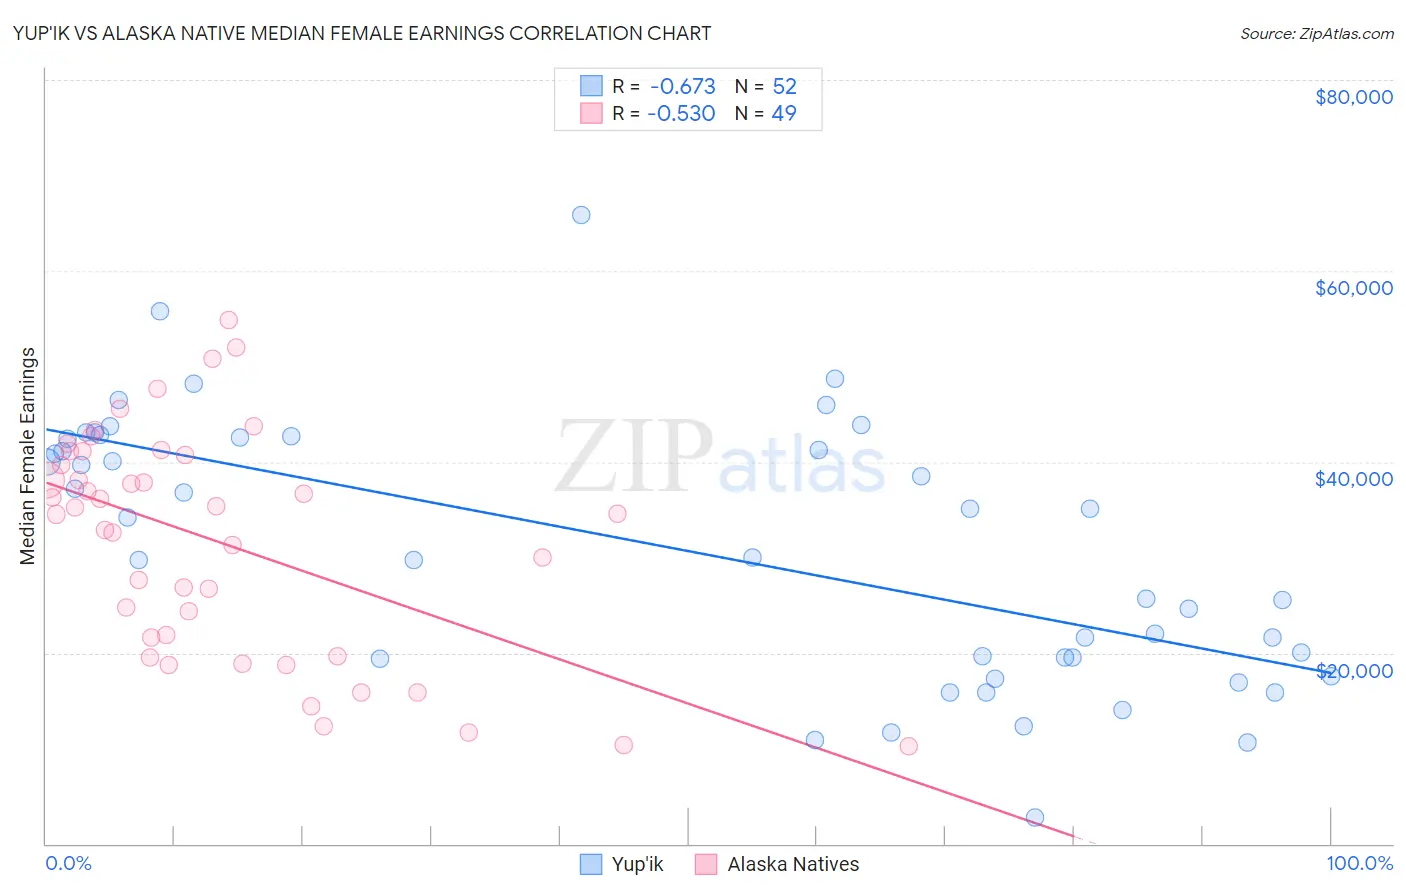
Yup'ik vs Alaska Native Median Female Earnings Correlation Chart
The statistical analysis conducted on geographies consisting of 39,946,861 people shows a significant negative correlation between the proportion of Yup'ik and median female earnings in the United States with a correlation coefficient (R) of -0.673 and weighted average of $32,730. Similarly, the statistical analysis conducted on geographies consisting of 76,744,414 people shows a substantial negative correlation between the proportion of Alaska Natives and median female earnings in the United States with a correlation coefficient (R) of -0.530 and weighted average of $38,202, a difference of 16.7%.
Median Female Earnings Correlation Summary
| Measurement | Yup'ik | Alaska Native |
| Minimum | $2,800 | $10,250 |
| Maximum | $65,833 | $54,922 |
| Range | $63,033 | $44,672 |
| Mean | $30,861 | $31,635 |
| Median | $32,085 | $34,583 |
| Interquartile 25% (IQ1) | $19,410 | $20,573 |
| Interquartile 75% (IQ3) | $42,445 | $40,922 |
| Interquartile Range (IQR) | $23,035 | $20,349 |
| Standard Deviation (Sample) | $13,771 | $11,761 |
| Standard Deviation (Population) | $13,638 | $11,640 |
Similar Demographics by Median Female Earnings
Demographics Similar to Yup'ik by Median Female Earnings
In terms of median female earnings, the demographic groups most similar to Yup'ik are Pueblo ($32,564, a difference of 0.51%), Lumbee ($32,500, a difference of 0.71%), Navajo ($33,046, a difference of 0.96%), Tohono O'odham ($33,205, a difference of 1.5%), and Immigrants from Mexico ($33,236, a difference of 1.5%).
| Demographics | Rating | Rank | Median Female Earnings |
| Mexicans | 0.0 /100 | #333 | Tragic $33,664 |
| Spanish American Indians | 0.0 /100 | #334 | Tragic $33,625 |
| Creek | 0.0 /100 | #335 | Tragic $33,437 |
| Ottawa | 0.0 /100 | #336 | Tragic $33,378 |
| Yakama | 0.0 /100 | #337 | Tragic $33,354 |
| Immigrants | Cuba | 0.0 /100 | #338 | Tragic $33,291 |
| Immigrants | Mexico | 0.0 /100 | #339 | Tragic $33,236 |
| Tohono O'odham | 0.0 /100 | #340 | Tragic $33,205 |
| Navajo | 0.0 /100 | #341 | Tragic $33,046 |
| Yup'ik | 0.0 /100 | #342 | Tragic $32,730 |
| Pueblo | 0.0 /100 | #343 | Tragic $32,564 |
| Lumbee | 0.0 /100 | #344 | Tragic $32,500 |
| Puerto Ricans | 0.0 /100 | #345 | Tragic $31,560 |
| Arapaho | 0.0 /100 | #346 | Tragic $31,489 |
| Houma | 0.0 /100 | #347 | Tragic $30,343 |
Demographics Similar to Alaska Natives by Median Female Earnings
In terms of median female earnings, the demographic groups most similar to Alaska Natives are Immigrants from Cabo Verde ($38,208, a difference of 0.020%), English ($38,196, a difference of 0.020%), Liberian ($38,215, a difference of 0.030%), Sudanese ($38,215, a difference of 0.040%), and Finnish ($38,173, a difference of 0.080%).
| Demographics | Rating | Rank | Median Female Earnings |
| Somalis | 5.5 /100 | #231 | Tragic $38,333 |
| Scandinavians | 5.2 /100 | #232 | Tragic $38,306 |
| Tongans | 5.1 /100 | #233 | Tragic $38,288 |
| Celtics | 5.0 /100 | #234 | Tragic $38,283 |
| Sudanese | 4.4 /100 | #235 | Tragic $38,215 |
| Liberians | 4.4 /100 | #236 | Tragic $38,215 |
| Immigrants | Cabo Verde | 4.3 /100 | #237 | Tragic $38,208 |
| Alaska Natives | 4.3 /100 | #238 | Tragic $38,202 |
| English | 4.2 /100 | #239 | Tragic $38,196 |
| Finns | 4.0 /100 | #240 | Tragic $38,173 |
| Spanish | 3.5 /100 | #241 | Tragic $38,098 |
| Immigrants | Burma/Myanmar | 3.0 /100 | #242 | Tragic $38,028 |
| Germans | 2.8 /100 | #243 | Tragic $37,986 |
| Immigrants | Liberia | 2.7 /100 | #244 | Tragic $37,970 |
| Immigrants | Middle Africa | 2.7 /100 | #245 | Tragic $37,965 |