Soviet Union vs Venezuelan Householder Income Over 65 years
COMPARE
Soviet Union
Venezuelan
Householder Income Over 65 years
Householder Income Over 65 years Comparison
Soviet Union
Venezuelans
$62,848
HOUSEHOLDER INCOME OVER 65 YEARS
87.8/ 100
METRIC RATING
125th/ 347
METRIC RANK
$58,026
HOUSEHOLDER INCOME OVER 65 YEARS
4.4/ 100
METRIC RATING
225th/ 347
METRIC RANK
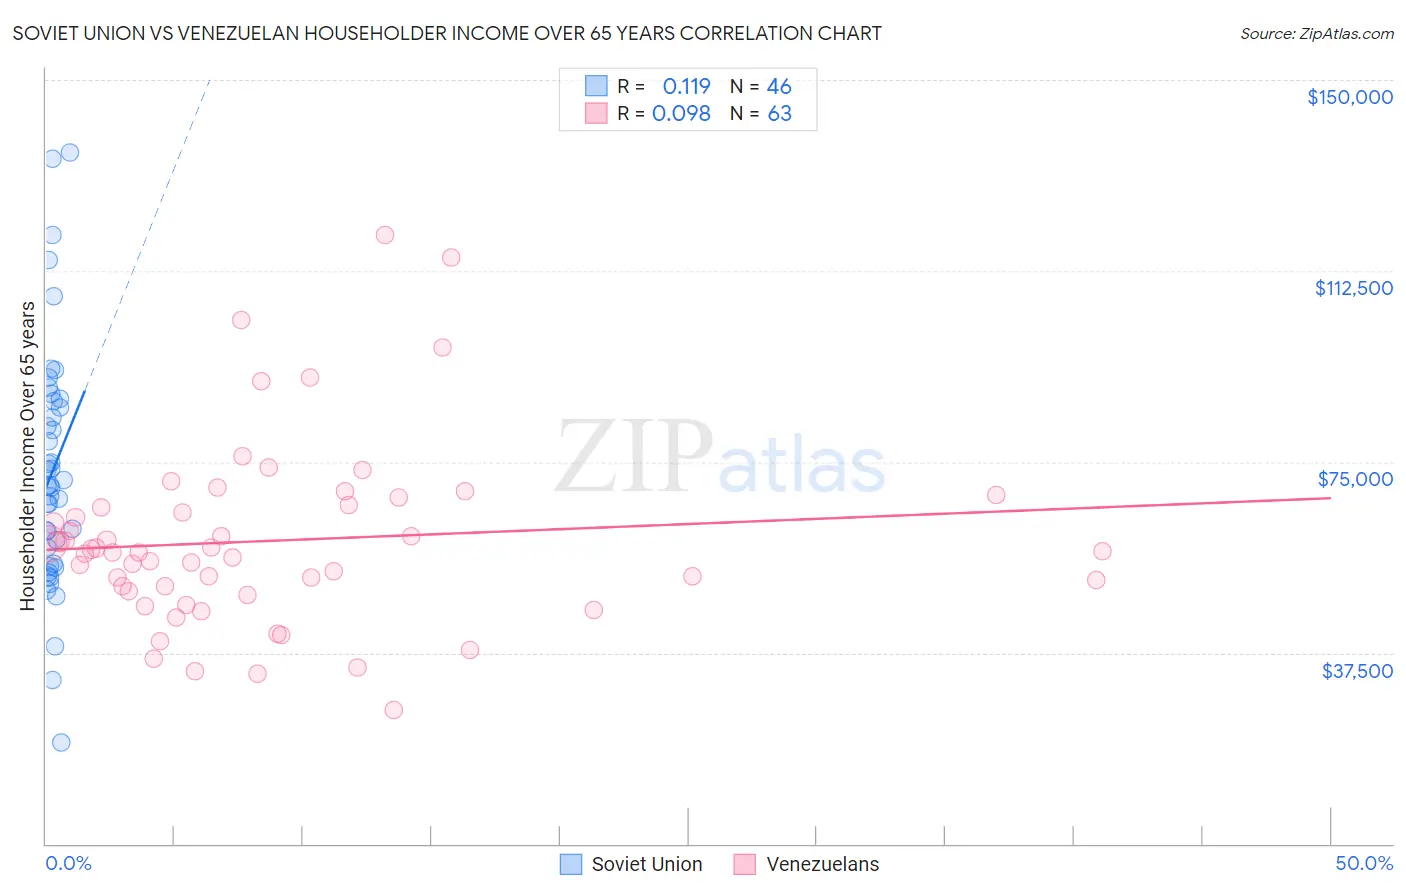
Soviet Union vs Venezuelan Householder Income Over 65 years Correlation Chart
The statistical analysis conducted on geographies consisting of 43,499,158 people shows a poor positive correlation between the proportion of Soviet Union and household income with householder over the age of 65 in the United States with a correlation coefficient (R) of 0.119 and weighted average of $62,848. Similarly, the statistical analysis conducted on geographies consisting of 305,429,725 people shows a slight positive correlation between the proportion of Venezuelans and household income with householder over the age of 65 in the United States with a correlation coefficient (R) of 0.098 and weighted average of $58,026, a difference of 8.3%.
Householder Income Over 65 years Correlation Summary
| Measurement | Soviet Union | Venezuelan |
| Minimum | $19,854 | $26,376 |
| Maximum | $135,833 | $119,643 |
| Range | $115,979 | $93,267 |
| Mean | $73,206 | $59,526 |
| Median | $70,343 | $57,305 |
| Interquartile 25% (IQ1) | $54,958 | $49,696 |
| Interquartile 75% (IQ3) | $87,025 | $66,429 |
| Interquartile Range (IQR) | $32,067 | $16,733 |
| Standard Deviation (Sample) | $23,972 | $18,107 |
| Standard Deviation (Population) | $23,710 | $17,963 |
Similar Demographics by Householder Income Over 65 years
Demographics Similar to Soviet Union by Householder Income Over 65 years
In terms of householder income over 65 years, the demographic groups most similar to Soviet Union are Taiwanese ($62,894, a difference of 0.070%), Tlingit-Haida ($62,922, a difference of 0.12%), Peruvian ($62,766, a difference of 0.13%), Immigrants from Moldova ($62,939, a difference of 0.14%), and Swedish ($62,736, a difference of 0.18%).
| Demographics | Rating | Rank | Householder Income Over 65 years |
| Danes | 90.5 /100 | #118 | Exceptional $63,117 |
| Immigrants | Jordan | 89.8 /100 | #119 | Excellent $63,041 |
| Ukrainians | 89.7 /100 | #120 | Excellent $63,032 |
| Immigrants | Vietnam | 89.5 /100 | #121 | Excellent $63,014 |
| Immigrants | Moldova | 88.7 /100 | #122 | Excellent $62,939 |
| Tlingit-Haida | 88.6 /100 | #123 | Excellent $62,922 |
| Taiwanese | 88.3 /100 | #124 | Excellent $62,894 |
| Soviet Union | 87.8 /100 | #125 | Excellent $62,848 |
| Peruvians | 86.8 /100 | #126 | Excellent $62,766 |
| Swedes | 86.4 /100 | #127 | Excellent $62,736 |
| Aleuts | 86.1 /100 | #128 | Excellent $62,708 |
| Immigrants | Eastern Europe | 85.9 /100 | #129 | Excellent $62,693 |
| Basques | 85.4 /100 | #130 | Excellent $62,653 |
| Immigrants | Western Asia | 85.3 /100 | #131 | Excellent $62,645 |
| Immigrants | Germany | 83.9 /100 | #132 | Excellent $62,544 |
Demographics Similar to Venezuelans by Householder Income Over 65 years
In terms of householder income over 65 years, the demographic groups most similar to Venezuelans are French Canadian ($57,975, a difference of 0.090%), Japanese ($57,919, a difference of 0.18%), Bermudan ($58,171, a difference of 0.25%), Tsimshian ($58,202, a difference of 0.30%), and Delaware ($58,214, a difference of 0.32%).
| Demographics | Rating | Rank | Householder Income Over 65 years |
| Panamanians | 5.6 /100 | #218 | Tragic $58,266 |
| Malaysians | 5.5 /100 | #219 | Tragic $58,244 |
| Yugoslavians | 5.5 /100 | #220 | Tragic $58,243 |
| Immigrants | El Salvador | 5.4 /100 | #221 | Tragic $58,226 |
| Delaware | 5.3 /100 | #222 | Tragic $58,214 |
| Tsimshian | 5.2 /100 | #223 | Tragic $58,202 |
| Bermudans | 5.1 /100 | #224 | Tragic $58,171 |
| Venezuelans | 4.4 /100 | #225 | Tragic $58,026 |
| French Canadians | 4.2 /100 | #226 | Tragic $57,975 |
| Japanese | 3.9 /100 | #227 | Tragic $57,919 |
| Immigrants | Albania | 3.6 /100 | #228 | Tragic $57,828 |
| Immigrants | Colombia | 3.0 /100 | #229 | Tragic $57,658 |
| Immigrants | Cambodia | 2.8 /100 | #230 | Tragic $57,580 |
| Immigrants | Nonimmigrants | 2.4 /100 | #231 | Tragic $57,426 |
| Immigrants | Venezuela | 2.3 /100 | #232 | Tragic $57,371 |