Portuguese vs Venezuelan Householder Income Over 65 years
COMPARE
Portuguese
Venezuelan
Householder Income Over 65 years
Householder Income Over 65 years Comparison
Portuguese
Venezuelans
$61,440
HOUSEHOLDER INCOME OVER 65 YEARS
62.1/ 100
METRIC RATING
160th/ 347
METRIC RANK
$58,026
HOUSEHOLDER INCOME OVER 65 YEARS
4.4/ 100
METRIC RATING
225th/ 347
METRIC RANK
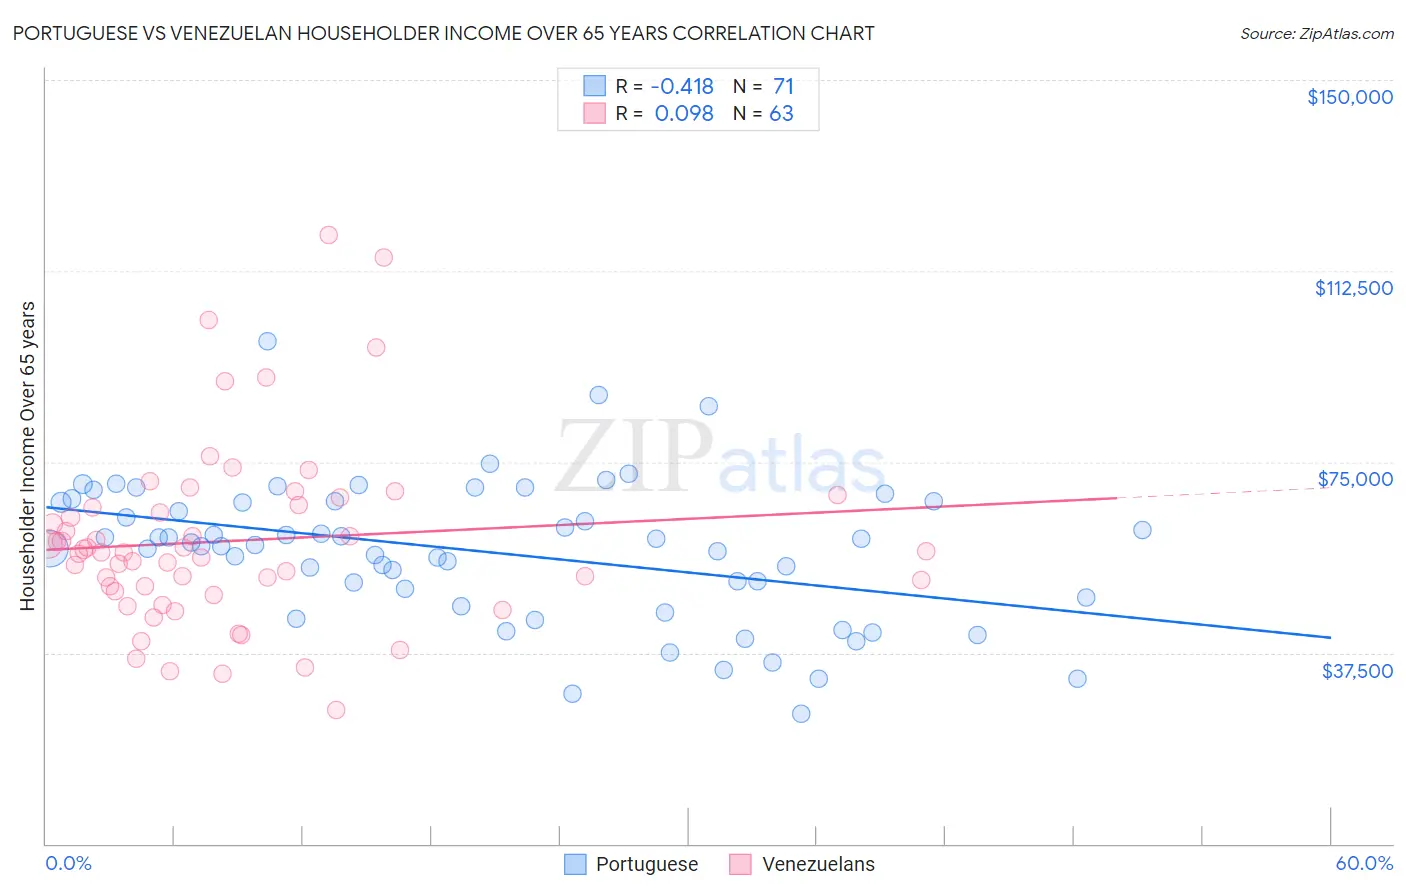
Portuguese vs Venezuelan Householder Income Over 65 years Correlation Chart
The statistical analysis conducted on geographies consisting of 448,159,780 people shows a moderate negative correlation between the proportion of Portuguese and household income with householder over the age of 65 in the United States with a correlation coefficient (R) of -0.418 and weighted average of $61,440. Similarly, the statistical analysis conducted on geographies consisting of 305,429,725 people shows a slight positive correlation between the proportion of Venezuelans and household income with householder over the age of 65 in the United States with a correlation coefficient (R) of 0.098 and weighted average of $58,026, a difference of 5.9%.
Householder Income Over 65 years Correlation Summary
| Measurement | Portuguese | Venezuelan |
| Minimum | $25,525 | $26,376 |
| Maximum | $98,662 | $119,643 |
| Range | $73,137 | $93,267 |
| Mean | $57,386 | $59,526 |
| Median | $58,571 | $57,305 |
| Interquartile 25% (IQ1) | $48,306 | $49,696 |
| Interquartile 75% (IQ3) | $67,302 | $66,429 |
| Interquartile Range (IQR) | $18,996 | $16,733 |
| Standard Deviation (Sample) | $13,814 | $18,107 |
| Standard Deviation (Population) | $13,716 | $17,963 |
Similar Demographics by Householder Income Over 65 years
Demographics Similar to Portuguese by Householder Income Over 65 years
In terms of householder income over 65 years, the demographic groups most similar to Portuguese are Brazilian ($61,465, a difference of 0.040%), English ($61,487, a difference of 0.080%), Macedonian ($61,564, a difference of 0.20%), Scandinavian ($61,586, a difference of 0.24%), and Polish ($61,598, a difference of 0.26%).
| Demographics | Rating | Rank | Householder Income Over 65 years |
| Costa Ricans | 66.9 /100 | #153 | Good $61,638 |
| Swiss | 66.5 /100 | #154 | Good $61,621 |
| Poles | 65.9 /100 | #155 | Good $61,598 |
| Scandinavians | 65.6 /100 | #156 | Good $61,586 |
| Macedonians | 65.1 /100 | #157 | Good $61,564 |
| English | 63.3 /100 | #158 | Good $61,487 |
| Brazilians | 62.7 /100 | #159 | Good $61,465 |
| Portuguese | 62.1 /100 | #160 | Good $61,440 |
| Icelanders | 57.9 /100 | #161 | Average $61,270 |
| Czechs | 57.2 /100 | #162 | Average $61,244 |
| Ugandans | 55.5 /100 | #163 | Average $61,177 |
| Immigrants | North Macedonia | 55.4 /100 | #164 | Average $61,175 |
| Immigrants | Ukraine | 55.1 /100 | #165 | Average $61,163 |
| Immigrants | Eastern Africa | 55.0 /100 | #166 | Average $61,157 |
| Norwegians | 53.6 /100 | #167 | Average $61,104 |
Demographics Similar to Venezuelans by Householder Income Over 65 years
In terms of householder income over 65 years, the demographic groups most similar to Venezuelans are French Canadian ($57,975, a difference of 0.090%), Japanese ($57,919, a difference of 0.18%), Bermudan ($58,171, a difference of 0.25%), Tsimshian ($58,202, a difference of 0.30%), and Delaware ($58,214, a difference of 0.32%).
| Demographics | Rating | Rank | Householder Income Over 65 years |
| Panamanians | 5.6 /100 | #218 | Tragic $58,266 |
| Malaysians | 5.5 /100 | #219 | Tragic $58,244 |
| Yugoslavians | 5.5 /100 | #220 | Tragic $58,243 |
| Immigrants | El Salvador | 5.4 /100 | #221 | Tragic $58,226 |
| Delaware | 5.3 /100 | #222 | Tragic $58,214 |
| Tsimshian | 5.2 /100 | #223 | Tragic $58,202 |
| Bermudans | 5.1 /100 | #224 | Tragic $58,171 |
| Venezuelans | 4.4 /100 | #225 | Tragic $58,026 |
| French Canadians | 4.2 /100 | #226 | Tragic $57,975 |
| Japanese | 3.9 /100 | #227 | Tragic $57,919 |
| Immigrants | Albania | 3.6 /100 | #228 | Tragic $57,828 |
| Immigrants | Colombia | 3.0 /100 | #229 | Tragic $57,658 |
| Immigrants | Cambodia | 2.8 /100 | #230 | Tragic $57,580 |
| Immigrants | Nonimmigrants | 2.4 /100 | #231 | Tragic $57,426 |
| Immigrants | Venezuela | 2.3 /100 | #232 | Tragic $57,371 |