Soviet Union vs Kenyan Householder Income Over 65 years
COMPARE
Soviet Union
Kenyan
Householder Income Over 65 years
Householder Income Over 65 years Comparison
Soviet Union
Kenyans
$62,848
HOUSEHOLDER INCOME OVER 65 YEARS
87.8/ 100
METRIC RATING
125th/ 347
METRIC RANK
$60,514
HOUSEHOLDER INCOME OVER 65 YEARS
38.4/ 100
METRIC RATING
183rd/ 347
METRIC RANK
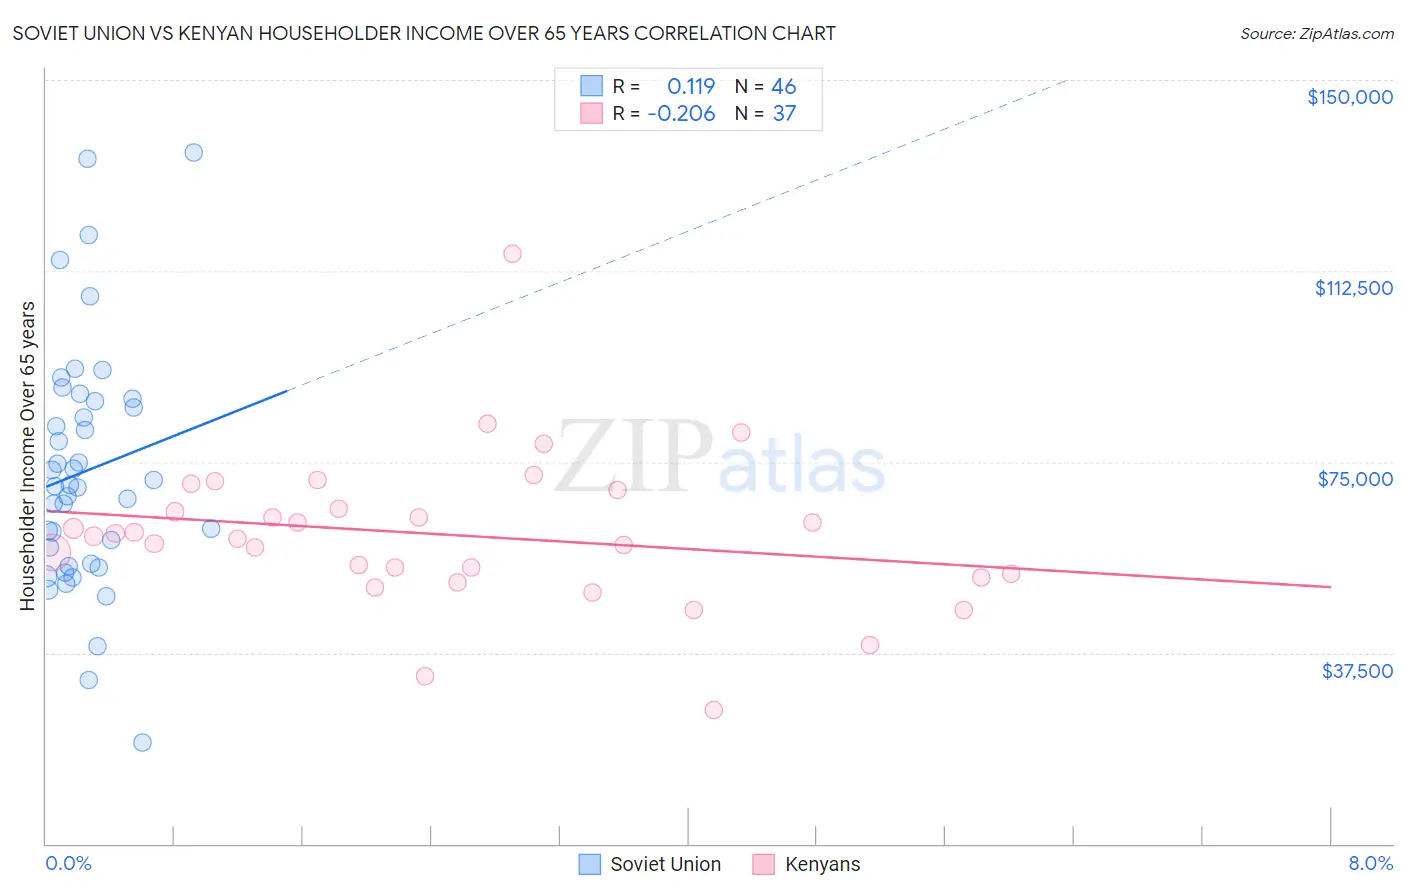
Soviet Union vs Kenyan Householder Income Over 65 years Correlation Chart
The statistical analysis conducted on geographies consisting of 43,499,158 people shows a poor positive correlation between the proportion of Soviet Union and household income with householder over the age of 65 in the United States with a correlation coefficient (R) of 0.119 and weighted average of $62,848. Similarly, the statistical analysis conducted on geographies consisting of 167,861,948 people shows a weak negative correlation between the proportion of Kenyans and household income with householder over the age of 65 in the United States with a correlation coefficient (R) of -0.206 and weighted average of $60,514, a difference of 3.9%.
Householder Income Over 65 years Correlation Summary
| Measurement | Soviet Union | Kenyan |
| Minimum | $19,854 | $26,155 |
| Maximum | $135,833 | $115,950 |
| Range | $115,979 | $89,795 |
| Mean | $73,206 | $60,697 |
| Median | $70,343 | $60,482 |
| Interquartile 25% (IQ1) | $54,958 | $52,723 |
| Interquartile 75% (IQ3) | $87,025 | $67,615 |
| Interquartile Range (IQR) | $32,067 | $14,892 |
| Standard Deviation (Sample) | $23,972 | $15,220 |
| Standard Deviation (Population) | $23,710 | $15,013 |
Similar Demographics by Householder Income Over 65 years
Demographics Similar to Soviet Union by Householder Income Over 65 years
In terms of householder income over 65 years, the demographic groups most similar to Soviet Union are Taiwanese ($62,894, a difference of 0.070%), Tlingit-Haida ($62,922, a difference of 0.12%), Peruvian ($62,766, a difference of 0.13%), Immigrants from Moldova ($62,939, a difference of 0.14%), and Swedish ($62,736, a difference of 0.18%).
| Demographics | Rating | Rank | Householder Income Over 65 years |
| Danes | 90.5 /100 | #118 | Exceptional $63,117 |
| Immigrants | Jordan | 89.8 /100 | #119 | Excellent $63,041 |
| Ukrainians | 89.7 /100 | #120 | Excellent $63,032 |
| Immigrants | Vietnam | 89.5 /100 | #121 | Excellent $63,014 |
| Immigrants | Moldova | 88.7 /100 | #122 | Excellent $62,939 |
| Tlingit-Haida | 88.6 /100 | #123 | Excellent $62,922 |
| Taiwanese | 88.3 /100 | #124 | Excellent $62,894 |
| Soviet Union | 87.8 /100 | #125 | Excellent $62,848 |
| Peruvians | 86.8 /100 | #126 | Excellent $62,766 |
| Swedes | 86.4 /100 | #127 | Excellent $62,736 |
| Aleuts | 86.1 /100 | #128 | Excellent $62,708 |
| Immigrants | Eastern Europe | 85.9 /100 | #129 | Excellent $62,693 |
| Basques | 85.4 /100 | #130 | Excellent $62,653 |
| Immigrants | Western Asia | 85.3 /100 | #131 | Excellent $62,645 |
| Immigrants | Germany | 83.9 /100 | #132 | Excellent $62,544 |
Demographics Similar to Kenyans by Householder Income Over 65 years
In terms of householder income over 65 years, the demographic groups most similar to Kenyans are Iraqi ($60,466, a difference of 0.080%), Czechoslovakian ($60,581, a difference of 0.11%), Celtic ($60,608, a difference of 0.15%), Immigrants from Morocco ($60,647, a difference of 0.22%), and Welsh ($60,666, a difference of 0.25%).
| Demographics | Rating | Rank | Householder Income Over 65 years |
| Spanish | 45.5 /100 | #176 | Average $60,795 |
| Alaska Natives | 44.3 /100 | #177 | Average $60,748 |
| Yup'ik | 43.7 /100 | #178 | Average $60,727 |
| Welsh | 42.2 /100 | #179 | Average $60,666 |
| Immigrants | Morocco | 41.7 /100 | #180 | Average $60,647 |
| Celtics | 40.7 /100 | #181 | Average $60,608 |
| Czechoslovakians | 40.0 /100 | #182 | Average $60,581 |
| Kenyans | 38.4 /100 | #183 | Fair $60,514 |
| Iraqis | 37.2 /100 | #184 | Fair $60,466 |
| Albanians | 32.0 /100 | #185 | Fair $60,249 |
| Slovenes | 31.8 /100 | #186 | Fair $60,241 |
| Immigrants | Thailand | 31.3 /100 | #187 | Fair $60,217 |
| Immigrants | Eritrea | 28.6 /100 | #188 | Fair $60,096 |
| Ghanaians | 27.5 /100 | #189 | Fair $60,043 |
| Puget Sound Salish | 25.3 /100 | #190 | Fair $59,934 |