Swiss vs Venezuelan Householder Income Over 65 years
COMPARE
Swiss
Venezuelan
Householder Income Over 65 years
Householder Income Over 65 years Comparison
Swiss
Venezuelans
$61,621
HOUSEHOLDER INCOME OVER 65 YEARS
66.5/ 100
METRIC RATING
154th/ 347
METRIC RANK
$58,026
HOUSEHOLDER INCOME OVER 65 YEARS
4.4/ 100
METRIC RATING
225th/ 347
METRIC RANK
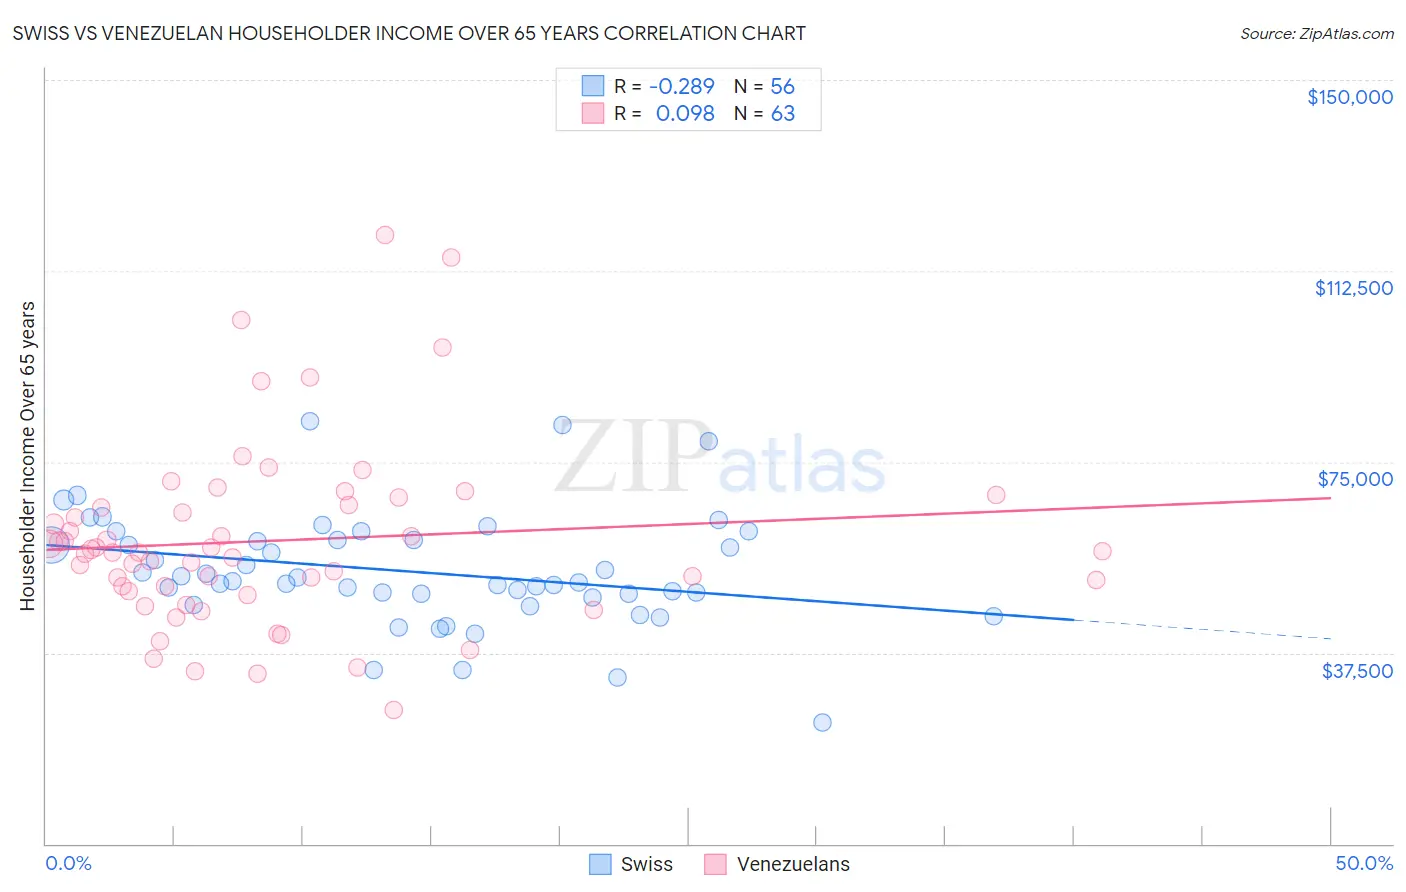
Swiss vs Venezuelan Householder Income Over 65 years Correlation Chart
The statistical analysis conducted on geographies consisting of 463,196,243 people shows a weak negative correlation between the proportion of Swiss and household income with householder over the age of 65 in the United States with a correlation coefficient (R) of -0.289 and weighted average of $61,621. Similarly, the statistical analysis conducted on geographies consisting of 305,429,725 people shows a slight positive correlation between the proportion of Venezuelans and household income with householder over the age of 65 in the United States with a correlation coefficient (R) of 0.098 and weighted average of $58,026, a difference of 6.2%.
Householder Income Over 65 years Correlation Summary
| Measurement | Swiss | Venezuelan |
| Minimum | $23,899 | $26,376 |
| Maximum | $83,019 | $119,643 |
| Range | $59,120 | $93,267 |
| Mean | $53,433 | $59,526 |
| Median | $51,480 | $57,305 |
| Interquartile 25% (IQ1) | $48,765 | $49,696 |
| Interquartile 75% (IQ3) | $59,727 | $66,429 |
| Interquartile Range (IQR) | $10,962 | $16,733 |
| Standard Deviation (Sample) | $11,086 | $18,107 |
| Standard Deviation (Population) | $10,986 | $17,963 |
Similar Demographics by Householder Income Over 65 years
Demographics Similar to Swiss by Householder Income Over 65 years
In terms of householder income over 65 years, the demographic groups most similar to Swiss are Costa Rican ($61,638, a difference of 0.030%), Polish ($61,598, a difference of 0.040%), Armenian ($61,656, a difference of 0.060%), Scandinavian ($61,586, a difference of 0.060%), and Hungarian ($61,673, a difference of 0.080%).
| Demographics | Rating | Rank | Householder Income Over 65 years |
| Immigrants | Nepal | 71.4 /100 | #147 | Good $61,843 |
| Alsatians | 70.5 /100 | #148 | Good $61,797 |
| Scottish | 69.1 /100 | #149 | Good $61,735 |
| Slavs | 68.5 /100 | #150 | Good $61,709 |
| Hungarians | 67.7 /100 | #151 | Good $61,673 |
| Armenians | 67.3 /100 | #152 | Good $61,656 |
| Costa Ricans | 66.9 /100 | #153 | Good $61,638 |
| Swiss | 66.5 /100 | #154 | Good $61,621 |
| Poles | 65.9 /100 | #155 | Good $61,598 |
| Scandinavians | 65.6 /100 | #156 | Good $61,586 |
| Macedonians | 65.1 /100 | #157 | Good $61,564 |
| English | 63.3 /100 | #158 | Good $61,487 |
| Brazilians | 62.7 /100 | #159 | Good $61,465 |
| Portuguese | 62.1 /100 | #160 | Good $61,440 |
| Icelanders | 57.9 /100 | #161 | Average $61,270 |
Demographics Similar to Venezuelans by Householder Income Over 65 years
In terms of householder income over 65 years, the demographic groups most similar to Venezuelans are French Canadian ($57,975, a difference of 0.090%), Japanese ($57,919, a difference of 0.18%), Bermudan ($58,171, a difference of 0.25%), Tsimshian ($58,202, a difference of 0.30%), and Delaware ($58,214, a difference of 0.32%).
| Demographics | Rating | Rank | Householder Income Over 65 years |
| Panamanians | 5.6 /100 | #218 | Tragic $58,266 |
| Malaysians | 5.5 /100 | #219 | Tragic $58,244 |
| Yugoslavians | 5.5 /100 | #220 | Tragic $58,243 |
| Immigrants | El Salvador | 5.4 /100 | #221 | Tragic $58,226 |
| Delaware | 5.3 /100 | #222 | Tragic $58,214 |
| Tsimshian | 5.2 /100 | #223 | Tragic $58,202 |
| Bermudans | 5.1 /100 | #224 | Tragic $58,171 |
| Venezuelans | 4.4 /100 | #225 | Tragic $58,026 |
| French Canadians | 4.2 /100 | #226 | Tragic $57,975 |
| Japanese | 3.9 /100 | #227 | Tragic $57,919 |
| Immigrants | Albania | 3.6 /100 | #228 | Tragic $57,828 |
| Immigrants | Colombia | 3.0 /100 | #229 | Tragic $57,658 |
| Immigrants | Cambodia | 2.8 /100 | #230 | Tragic $57,580 |
| Immigrants | Nonimmigrants | 2.4 /100 | #231 | Tragic $57,426 |
| Immigrants | Venezuela | 2.3 /100 | #232 | Tragic $57,371 |