Soviet Union vs South American Indian Householder Income Over 65 years
COMPARE
Soviet Union
South American Indian
Householder Income Over 65 years
Householder Income Over 65 years Comparison
Soviet Union
South American Indians
$62,848
HOUSEHOLDER INCOME OVER 65 YEARS
87.8/ 100
METRIC RATING
125th/ 347
METRIC RANK
$62,215
HOUSEHOLDER INCOME OVER 65 YEARS
78.7/ 100
METRIC RATING
142nd/ 347
METRIC RANK
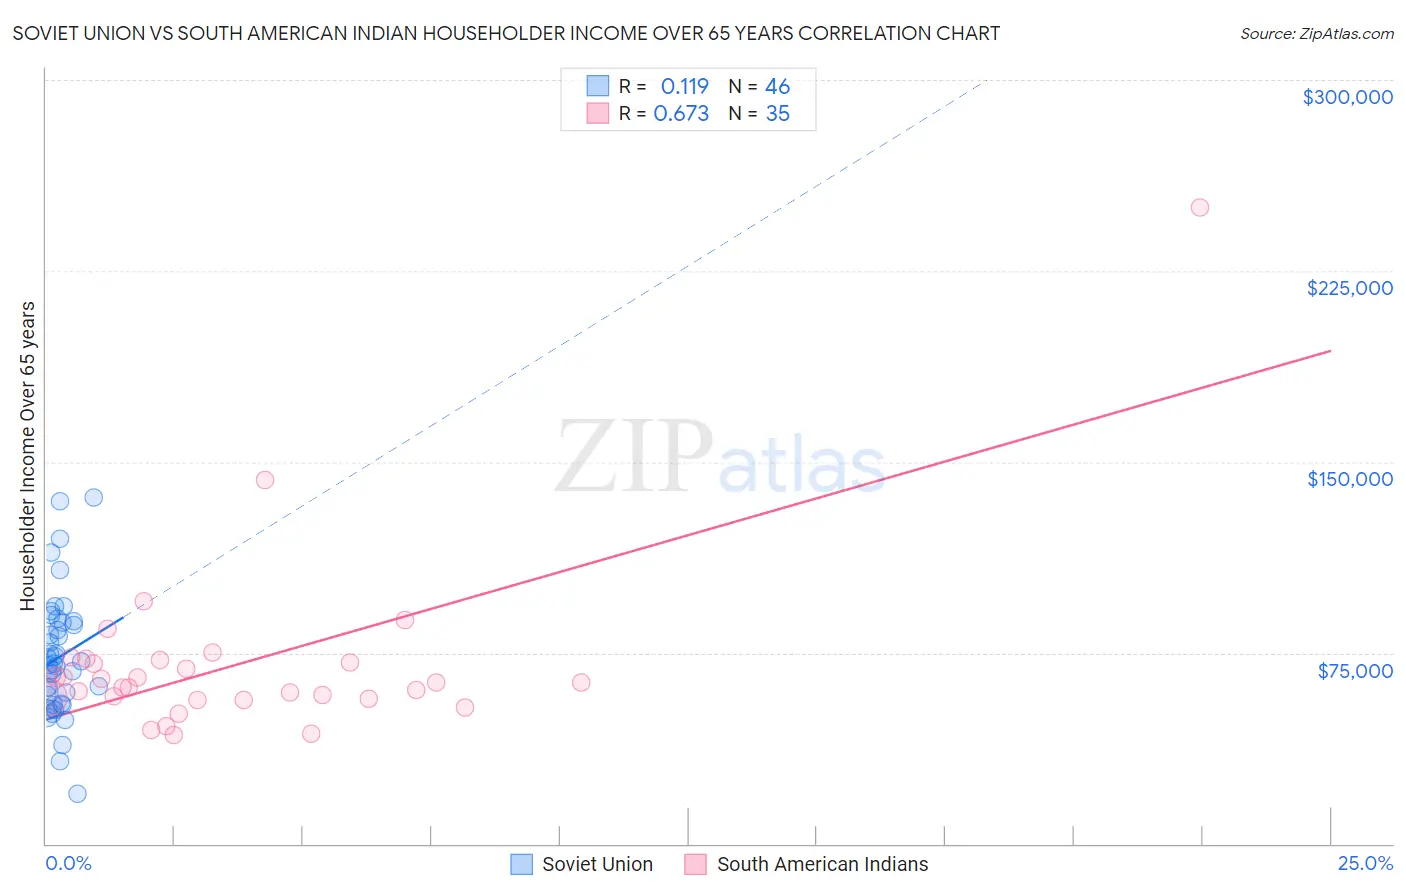
Soviet Union vs South American Indian Householder Income Over 65 years Correlation Chart
The statistical analysis conducted on geographies consisting of 43,499,158 people shows a poor positive correlation between the proportion of Soviet Union and household income with householder over the age of 65 in the United States with a correlation coefficient (R) of 0.119 and weighted average of $62,848. Similarly, the statistical analysis conducted on geographies consisting of 164,391,818 people shows a significant positive correlation between the proportion of South American Indians and household income with householder over the age of 65 in the United States with a correlation coefficient (R) of 0.673 and weighted average of $62,215, a difference of 1.0%.
Householder Income Over 65 years Correlation Summary
| Measurement | Soviet Union | South American Indian |
| Minimum | $19,854 | $42,500 |
| Maximum | $135,833 | $250,001 |
| Range | $115,979 | $207,501 |
| Mean | $73,206 | $70,859 |
| Median | $70,343 | $63,281 |
| Interquartile 25% (IQ1) | $54,958 | $56,818 |
| Interquartile 75% (IQ3) | $87,025 | $72,159 |
| Interquartile Range (IQR) | $32,067 | $15,341 |
| Standard Deviation (Sample) | $23,972 | $35,900 |
| Standard Deviation (Population) | $23,710 | $35,384 |
Demographics Similar to Soviet Union and South American Indians by Householder Income Over 65 years
In terms of householder income over 65 years, the demographic groups most similar to Soviet Union are Taiwanese ($62,894, a difference of 0.070%), Tlingit-Haida ($62,922, a difference of 0.12%), Peruvian ($62,766, a difference of 0.13%), Swedish ($62,736, a difference of 0.18%), and Aleut ($62,708, a difference of 0.22%). Similarly, the demographic groups most similar to South American Indians are Canadian ($62,230, a difference of 0.020%), Arab ($62,266, a difference of 0.080%), Immigrants from Belarus ($62,162, a difference of 0.090%), Immigrants from Kazakhstan ($62,292, a difference of 0.12%), and Lebanese ($62,287, a difference of 0.12%).
| Demographics | Rating | Rank | Householder Income Over 65 years |
| Tlingit-Haida | 88.6 /100 | #123 | Excellent $62,922 |
| Taiwanese | 88.3 /100 | #124 | Excellent $62,894 |
| Soviet Union | 87.8 /100 | #125 | Excellent $62,848 |
| Peruvians | 86.8 /100 | #126 | Excellent $62,766 |
| Swedes | 86.4 /100 | #127 | Excellent $62,736 |
| Aleuts | 86.1 /100 | #128 | Excellent $62,708 |
| Immigrants | Eastern Europe | 85.9 /100 | #129 | Excellent $62,693 |
| Basques | 85.4 /100 | #130 | Excellent $62,653 |
| Immigrants | Western Asia | 85.3 /100 | #131 | Excellent $62,645 |
| Immigrants | Germany | 83.9 /100 | #132 | Excellent $62,544 |
| Immigrants | Northern Africa | 83.6 /100 | #133 | Excellent $62,522 |
| Immigrants | Brazil | 81.2 /100 | #134 | Excellent $62,364 |
| Immigrants | Chile | 81.0 /100 | #135 | Excellent $62,354 |
| Alaskan Athabascans | 80.6 /100 | #136 | Excellent $62,330 |
| Immigrants | Syria | 80.2 /100 | #137 | Excellent $62,303 |
| Immigrants | Kazakhstan | 80.0 /100 | #138 | Excellent $62,292 |
| Lebanese | 79.9 /100 | #139 | Good $62,287 |
| Arabs | 79.6 /100 | #140 | Good $62,266 |
| Canadians | 79.0 /100 | #141 | Good $62,230 |
| South American Indians | 78.7 /100 | #142 | Good $62,215 |
| Immigrants | Belarus | 77.8 /100 | #143 | Good $62,162 |