Soviet Union vs Italian Householder Income Over 65 years
COMPARE
Soviet Union
Italian
Householder Income Over 65 years
Householder Income Over 65 years Comparison
Soviet Union
Italians
$62,848
HOUSEHOLDER INCOME OVER 65 YEARS
87.8/ 100
METRIC RATING
125th/ 347
METRIC RANK
$63,885
HOUSEHOLDER INCOME OVER 65 YEARS
95.5/ 100
METRIC RATING
105th/ 347
METRIC RANK
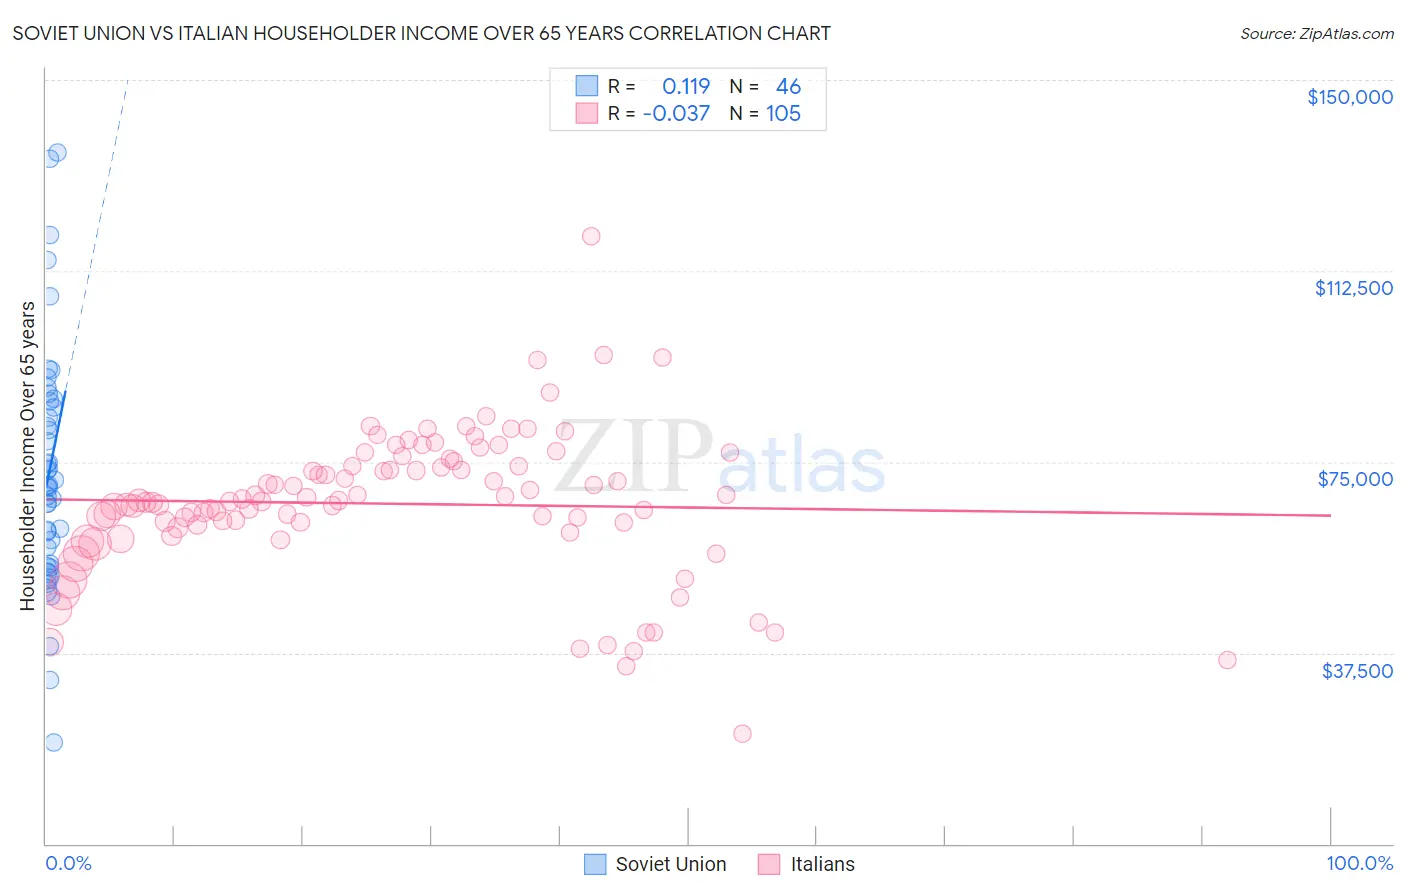
Soviet Union vs Italian Householder Income Over 65 years Correlation Chart
The statistical analysis conducted on geographies consisting of 43,499,158 people shows a poor positive correlation between the proportion of Soviet Union and household income with householder over the age of 65 in the United States with a correlation coefficient (R) of 0.119 and weighted average of $62,848. Similarly, the statistical analysis conducted on geographies consisting of 569,380,775 people shows no correlation between the proportion of Italians and household income with householder over the age of 65 in the United States with a correlation coefficient (R) of -0.037 and weighted average of $63,885, a difference of 1.7%.
Householder Income Over 65 years Correlation Summary
| Measurement | Soviet Union | Italian |
| Minimum | $19,854 | $21,635 |
| Maximum | $135,833 | $119,405 |
| Range | $115,979 | $97,770 |
| Mean | $73,206 | $66,782 |
| Median | $70,343 | $67,205 |
| Interquartile 25% (IQ1) | $54,958 | $62,321 |
| Interquartile 75% (IQ3) | $87,025 | $74,713 |
| Interquartile Range (IQR) | $32,067 | $12,392 |
| Standard Deviation (Sample) | $23,972 | $14,390 |
| Standard Deviation (Population) | $23,710 | $14,321 |
Demographics Similar to Soviet Union and Italians by Householder Income Over 65 years
In terms of householder income over 65 years, the demographic groups most similar to Soviet Union are Taiwanese ($62,894, a difference of 0.070%), Tlingit-Haida ($62,922, a difference of 0.12%), Immigrants from Moldova ($62,939, a difference of 0.14%), Immigrants from Vietnam ($63,014, a difference of 0.26%), and Ukrainian ($63,032, a difference of 0.29%). Similarly, the demographic groups most similar to Italians are Immigrants from Argentina ($63,885, a difference of 0.0%), Pakistani ($63,844, a difference of 0.060%), Palestinian ($63,800, a difference of 0.13%), European ($63,779, a difference of 0.17%), and Immigrants from Zimbabwe ($63,643, a difference of 0.38%).
| Demographics | Rating | Rank | Householder Income Over 65 years |
| Italians | 95.5 /100 | #105 | Exceptional $63,885 |
| Immigrants | Argentina | 95.5 /100 | #106 | Exceptional $63,885 |
| Pakistanis | 95.3 /100 | #107 | Exceptional $63,844 |
| Palestinians | 95.1 /100 | #108 | Exceptional $63,800 |
| Europeans | 95.0 /100 | #109 | Exceptional $63,779 |
| Immigrants | Zimbabwe | 94.3 /100 | #110 | Exceptional $63,643 |
| Immigrants | Spain | 93.7 /100 | #111 | Exceptional $63,540 |
| Syrians | 93.4 /100 | #112 | Exceptional $63,494 |
| Immigrants | Serbia | 92.7 /100 | #113 | Exceptional $63,387 |
| Immigrants | Saudi Arabia | 92.4 /100 | #114 | Exceptional $63,355 |
| Croatians | 91.4 /100 | #115 | Exceptional $63,225 |
| Guamanians/Chamorros | 91.1 /100 | #116 | Exceptional $63,187 |
| Immigrants | Croatia | 90.9 /100 | #117 | Exceptional $63,168 |
| Danes | 90.5 /100 | #118 | Exceptional $63,117 |
| Immigrants | Jordan | 89.8 /100 | #119 | Excellent $63,041 |
| Ukrainians | 89.7 /100 | #120 | Excellent $63,032 |
| Immigrants | Vietnam | 89.5 /100 | #121 | Excellent $63,014 |
| Immigrants | Moldova | 88.7 /100 | #122 | Excellent $62,939 |
| Tlingit-Haida | 88.6 /100 | #123 | Excellent $62,922 |
| Taiwanese | 88.3 /100 | #124 | Excellent $62,894 |
| Soviet Union | 87.8 /100 | #125 | Excellent $62,848 |