Soviet Union vs Venezuelan College, 1 year or more
COMPARE
Soviet Union
Venezuelan
College, 1 year or more
College, 1 year or more Comparison
Soviet Union
Venezuelans
66.4%
COLLEGE, 1 YEAR OR MORE
100.0/ 100
METRIC RATING
22nd/ 347
METRIC RANK
61.3%
COLLEGE, 1 YEAR OR MORE
92.1/ 100
METRIC RATING
124th/ 347
METRIC RANK
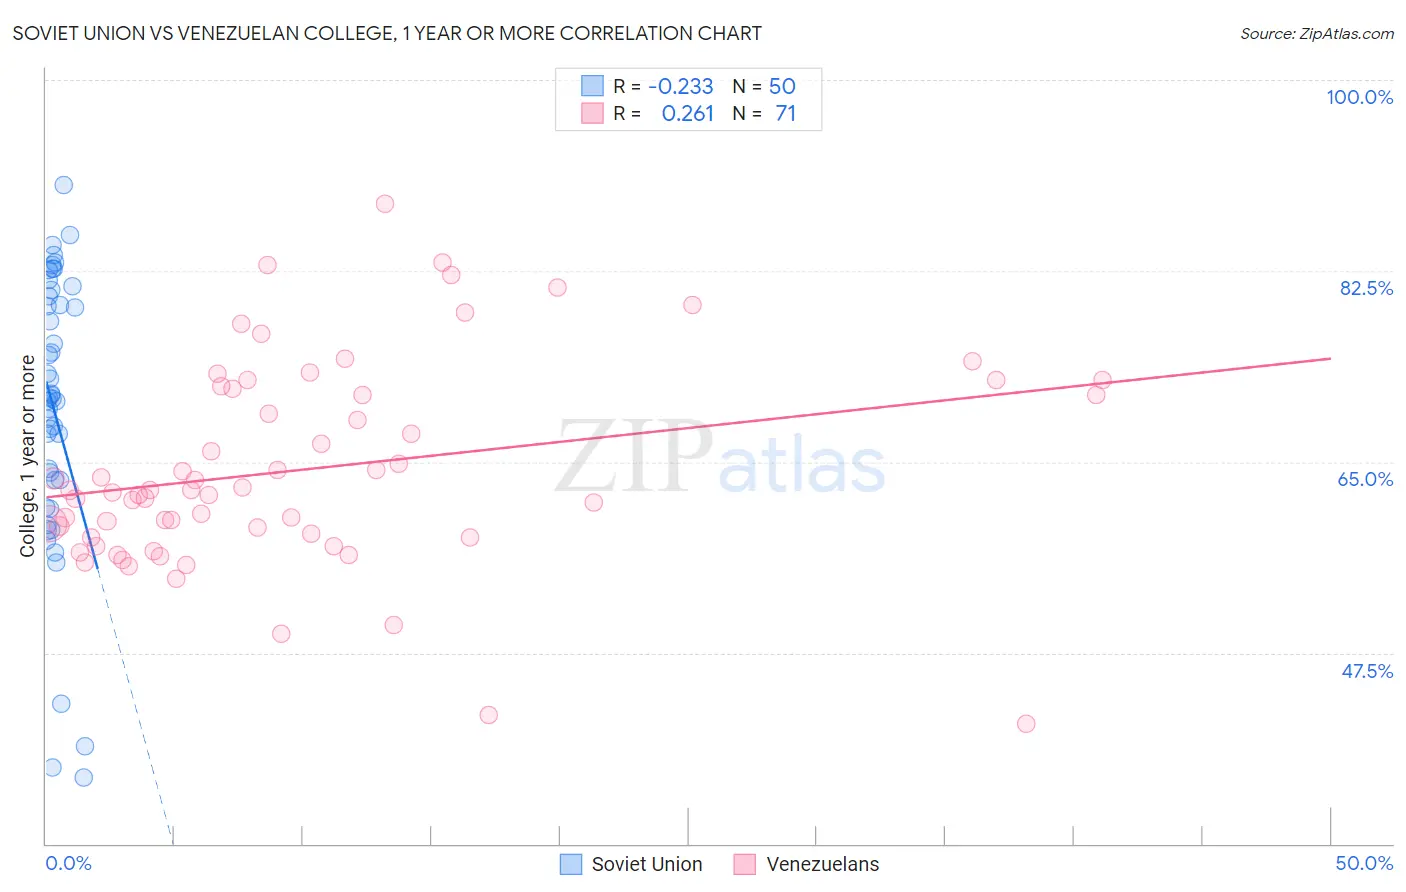
Soviet Union vs Venezuelan College, 1 year or more Correlation Chart
The statistical analysis conducted on geographies consisting of 43,514,626 people shows a weak negative correlation between the proportion of Soviet Union and percentage of population with at least college, 1 year or more education in the United States with a correlation coefficient (R) of -0.233 and weighted average of 66.4%. Similarly, the statistical analysis conducted on geographies consisting of 306,322,543 people shows a weak positive correlation between the proportion of Venezuelans and percentage of population with at least college, 1 year or more education in the United States with a correlation coefficient (R) of 0.261 and weighted average of 61.3%, a difference of 8.3%.
College, 1 year or more Correlation Summary
| Measurement | Soviet Union | Venezuelan |
| Minimum | 36.1% | 41.0% |
| Maximum | 90.4% | 88.6% |
| Range | 54.3% | 47.7% |
| Mean | 69.7% | 64.3% |
| Median | 70.9% | 62.4% |
| Interquartile 25% (IQ1) | 63.3% | 58.1% |
| Interquartile 75% (IQ3) | 80.2% | 71.7% |
| Interquartile Range (IQR) | 16.9% | 13.6% |
| Standard Deviation (Sample) | 12.8% | 9.4% |
| Standard Deviation (Population) | 12.6% | 9.3% |
Similar Demographics by College, 1 year or more
Demographics Similar to Soviet Union by College, 1 year or more
In terms of college, 1 year or more, the demographic groups most similar to Soviet Union are Immigrants from Hong Kong (66.4%, a difference of 0.060%), Immigrants from China (66.4%, a difference of 0.060%), Immigrants from Korea (66.5%, a difference of 0.13%), Immigrants from Belgium (66.3%, a difference of 0.14%), and Immigrants from Switzerland (66.5%, a difference of 0.17%).
| Demographics | Rating | Rank | College, 1 year or more |
| Cambodians | 100.0 /100 | #15 | Exceptional 66.7% |
| Immigrants | Japan | 100.0 /100 | #16 | Exceptional 66.7% |
| Immigrants | Eastern Asia | 100.0 /100 | #17 | Exceptional 66.6% |
| Eastern Europeans | 100.0 /100 | #18 | Exceptional 66.6% |
| Immigrants | Switzerland | 100.0 /100 | #19 | Exceptional 66.5% |
| Immigrants | Korea | 100.0 /100 | #20 | Exceptional 66.5% |
| Immigrants | Hong Kong | 100.0 /100 | #21 | Exceptional 66.4% |
| Soviet Union | 100.0 /100 | #22 | Exceptional 66.4% |
| Immigrants | China | 100.0 /100 | #23 | Exceptional 66.4% |
| Immigrants | Belgium | 100.0 /100 | #24 | Exceptional 66.3% |
| Indians (Asian) | 100.0 /100 | #25 | Exceptional 66.1% |
| Latvians | 100.0 /100 | #26 | Exceptional 66.1% |
| Immigrants | Ireland | 100.0 /100 | #27 | Exceptional 65.9% |
| Immigrants | France | 100.0 /100 | #28 | Exceptional 65.8% |
| Immigrants | Northern Europe | 100.0 /100 | #29 | Exceptional 65.6% |
Demographics Similar to Venezuelans by College, 1 year or more
In terms of college, 1 year or more, the demographic groups most similar to Venezuelans are Serbian (61.4%, a difference of 0.030%), Immigrants from Chile (61.4%, a difference of 0.040%), Immigrants from Syria (61.3%, a difference of 0.080%), Immigrants from Jordan (61.4%, a difference of 0.12%), and Alsatian (61.3%, a difference of 0.13%).
| Demographics | Rating | Rank | College, 1 year or more |
| Arabs | 93.9 /100 | #117 | Exceptional 61.6% |
| Immigrants | Brazil | 93.9 /100 | #118 | Exceptional 61.6% |
| Assyrians/Chaldeans/Syriacs | 93.3 /100 | #119 | Exceptional 61.5% |
| Pakistanis | 93.2 /100 | #120 | Exceptional 61.5% |
| Immigrants | Jordan | 92.7 /100 | #121 | Exceptional 61.4% |
| Immigrants | Chile | 92.3 /100 | #122 | Exceptional 61.4% |
| Serbians | 92.2 /100 | #123 | Exceptional 61.4% |
| Venezuelans | 92.1 /100 | #124 | Exceptional 61.3% |
| Immigrants | Syria | 91.6 /100 | #125 | Exceptional 61.3% |
| Alsatians | 91.3 /100 | #126 | Exceptional 61.3% |
| Immigrants | Eastern Africa | 91.1 /100 | #127 | Exceptional 61.2% |
| Immigrants | Italy | 91.1 /100 | #128 | Exceptional 61.2% |
| Ugandans | 90.7 /100 | #129 | Exceptional 61.2% |
| Italians | 89.5 /100 | #130 | Excellent 61.1% |
| Immigrants | Morocco | 89.5 /100 | #131 | Excellent 61.1% |