Cape Verdean vs Venezuelan Householder Income Over 65 years
COMPARE
Cape Verdean
Venezuelan
Householder Income Over 65 years
Householder Income Over 65 years Comparison
Cape Verdeans
Venezuelans
$50,077
HOUSEHOLDER INCOME OVER 65 YEARS
0.0/ 100
METRIC RATING
333rd/ 347
METRIC RANK
$58,026
HOUSEHOLDER INCOME OVER 65 YEARS
4.4/ 100
METRIC RATING
225th/ 347
METRIC RANK
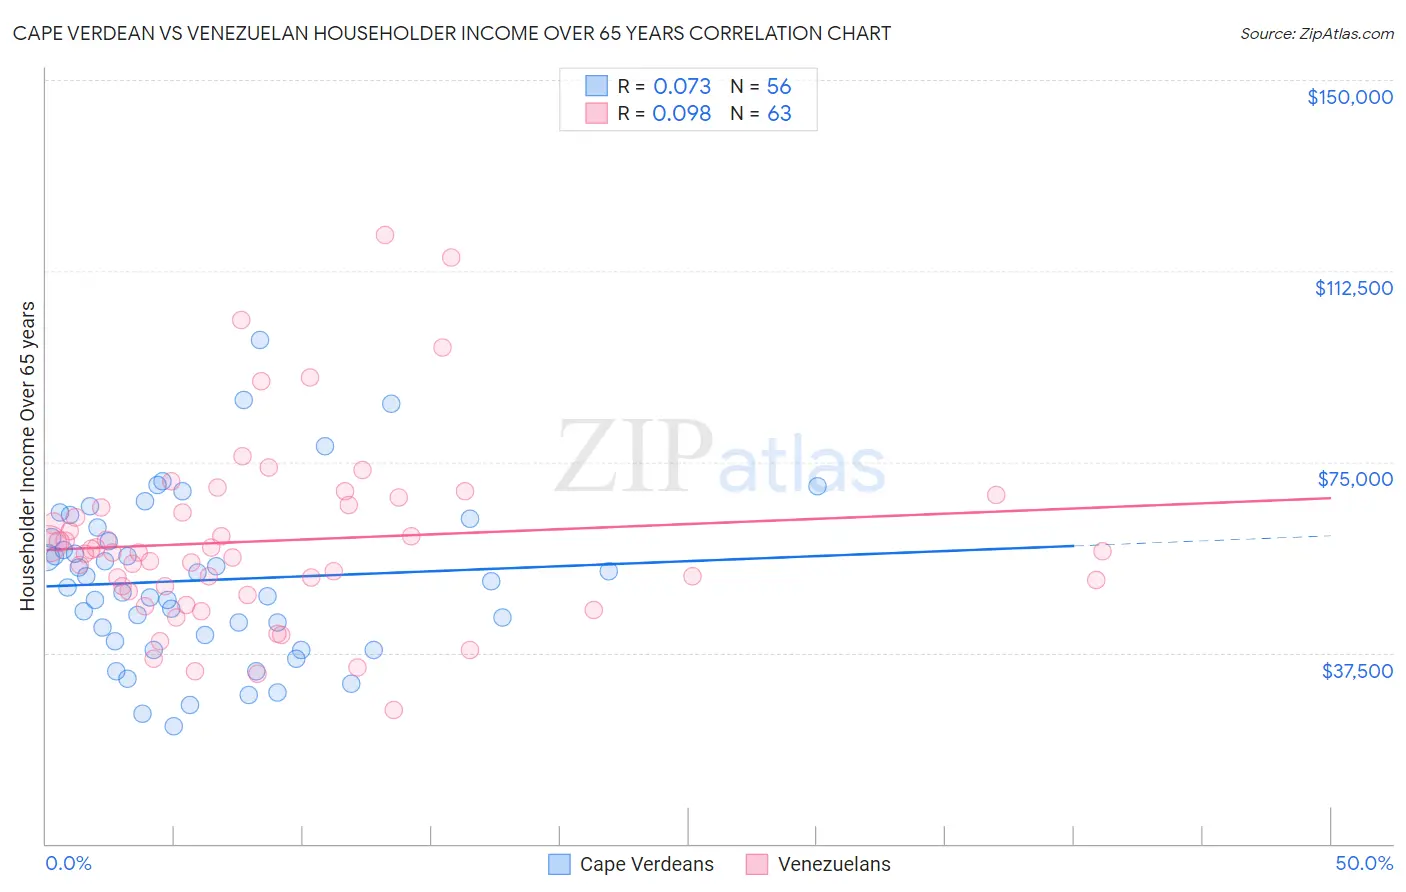
Cape Verdean vs Venezuelan Householder Income Over 65 years Correlation Chart
The statistical analysis conducted on geographies consisting of 107,432,324 people shows a slight positive correlation between the proportion of Cape Verdeans and household income with householder over the age of 65 in the United States with a correlation coefficient (R) of 0.073 and weighted average of $50,077. Similarly, the statistical analysis conducted on geographies consisting of 305,429,725 people shows a slight positive correlation between the proportion of Venezuelans and household income with householder over the age of 65 in the United States with a correlation coefficient (R) of 0.098 and weighted average of $58,026, a difference of 15.9%.
Householder Income Over 65 years Correlation Summary
| Measurement | Cape Verdean | Venezuelan |
| Minimum | $23,194 | $26,376 |
| Maximum | $98,819 | $119,643 |
| Range | $75,625 | $93,267 |
| Mean | $51,774 | $59,526 |
| Median | $50,968 | $57,305 |
| Interquartile 25% (IQ1) | $40,388 | $49,696 |
| Interquartile 75% (IQ3) | $61,045 | $66,429 |
| Interquartile Range (IQR) | $20,657 | $16,733 |
| Standard Deviation (Sample) | $15,999 | $18,107 |
| Standard Deviation (Population) | $15,855 | $17,963 |
Similar Demographics by Householder Income Over 65 years
Demographics Similar to Cape Verdeans by Householder Income Over 65 years
In terms of householder income over 65 years, the demographic groups most similar to Cape Verdeans are Immigrants from Dominica ($50,071, a difference of 0.010%), Dutch West Indian ($50,475, a difference of 0.79%), Pima ($50,539, a difference of 0.92%), Immigrants from Grenada ($50,747, a difference of 1.3%), and Black/African American ($50,779, a difference of 1.4%).
| Demographics | Rating | Rank | Householder Income Over 65 years |
| Kiowa | 0.0 /100 | #326 | Tragic $51,140 |
| Bahamians | 0.0 /100 | #327 | Tragic $51,000 |
| Hopi | 0.0 /100 | #328 | Tragic $50,925 |
| Blacks/African Americans | 0.0 /100 | #329 | Tragic $50,779 |
| Immigrants | Grenada | 0.0 /100 | #330 | Tragic $50,747 |
| Pima | 0.0 /100 | #331 | Tragic $50,539 |
| Dutch West Indians | 0.0 /100 | #332 | Tragic $50,475 |
| Cape Verdeans | 0.0 /100 | #333 | Tragic $50,077 |
| Immigrants | Dominica | 0.0 /100 | #334 | Tragic $50,071 |
| Crow | 0.0 /100 | #335 | Tragic $49,234 |
| Cubans | 0.0 /100 | #336 | Tragic $49,152 |
| Tohono O'odham | 0.0 /100 | #337 | Tragic $49,121 |
| Immigrants | Caribbean | 0.0 /100 | #338 | Tragic $48,535 |
| Navajo | 0.0 /100 | #339 | Tragic $47,722 |
| Immigrants | Yemen | 0.0 /100 | #340 | Tragic $47,527 |
Demographics Similar to Venezuelans by Householder Income Over 65 years
In terms of householder income over 65 years, the demographic groups most similar to Venezuelans are French Canadian ($57,975, a difference of 0.090%), Japanese ($57,919, a difference of 0.18%), Bermudan ($58,171, a difference of 0.25%), Tsimshian ($58,202, a difference of 0.30%), and Delaware ($58,214, a difference of 0.32%).
| Demographics | Rating | Rank | Householder Income Over 65 years |
| Panamanians | 5.6 /100 | #218 | Tragic $58,266 |
| Malaysians | 5.5 /100 | #219 | Tragic $58,244 |
| Yugoslavians | 5.5 /100 | #220 | Tragic $58,243 |
| Immigrants | El Salvador | 5.4 /100 | #221 | Tragic $58,226 |
| Delaware | 5.3 /100 | #222 | Tragic $58,214 |
| Tsimshian | 5.2 /100 | #223 | Tragic $58,202 |
| Bermudans | 5.1 /100 | #224 | Tragic $58,171 |
| Venezuelans | 4.4 /100 | #225 | Tragic $58,026 |
| French Canadians | 4.2 /100 | #226 | Tragic $57,975 |
| Japanese | 3.9 /100 | #227 | Tragic $57,919 |
| Immigrants | Albania | 3.6 /100 | #228 | Tragic $57,828 |
| Immigrants | Colombia | 3.0 /100 | #229 | Tragic $57,658 |
| Immigrants | Cambodia | 2.8 /100 | #230 | Tragic $57,580 |
| Immigrants | Nonimmigrants | 2.4 /100 | #231 | Tragic $57,426 |
| Immigrants | Venezuela | 2.3 /100 | #232 | Tragic $57,371 |