Soviet Union vs Italian Median Earnings
COMPARE
Soviet Union
Italian
Median Earnings
Median Earnings Comparison
Soviet Union
Italians
$54,290
MEDIAN EARNINGS
100.0/ 100
METRIC RATING
24th/ 347
METRIC RANK
$49,915
MEDIAN EARNINGS
99.3/ 100
METRIC RATING
90th/ 347
METRIC RANK
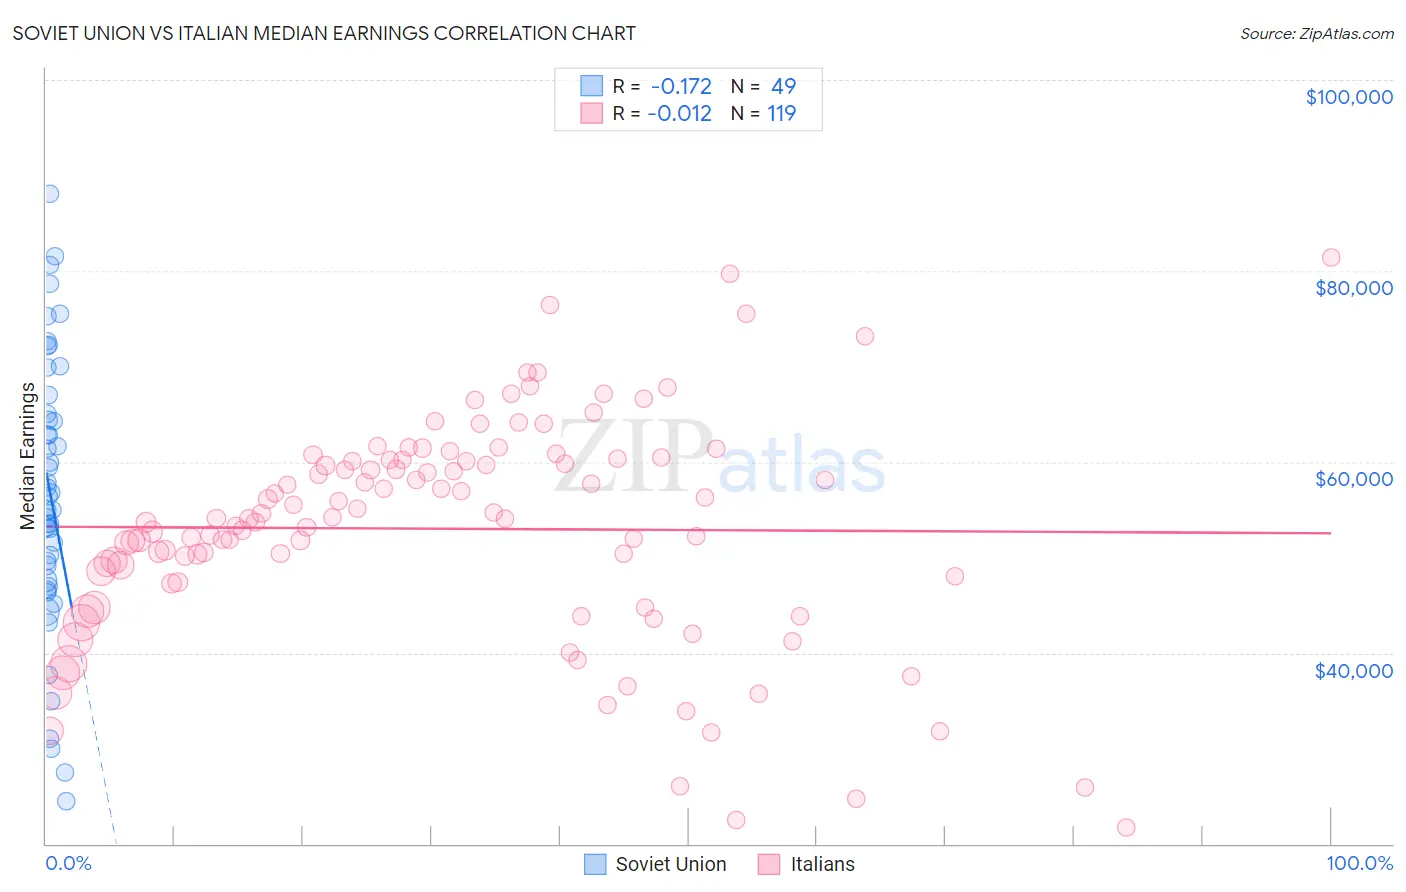
Soviet Union vs Italian Median Earnings Correlation Chart
The statistical analysis conducted on geographies consisting of 43,511,973 people shows a poor negative correlation between the proportion of Soviet Union and median earnings in the United States with a correlation coefficient (R) of -0.172 and weighted average of $54,290. Similarly, the statistical analysis conducted on geographies consisting of 574,669,176 people shows no correlation between the proportion of Italians and median earnings in the United States with a correlation coefficient (R) of -0.012 and weighted average of $49,915, a difference of 8.8%.
Median Earnings Correlation Summary
| Measurement | Soviet Union | Italian |
| Minimum | $24,432 | $21,728 |
| Maximum | $88,077 | $81,458 |
| Range | $63,645 | $59,730 |
| Mean | $56,673 | $52,992 |
| Median | $56,451 | $54,091 |
| Interquartile 25% (IQ1) | $47,287 | $47,401 |
| Interquartile 75% (IQ3) | $65,993 | $60,200 |
| Interquartile Range (IQR) | $18,706 | $12,799 |
| Standard Deviation (Sample) | $14,478 | $11,690 |
| Standard Deviation (Population) | $14,329 | $11,640 |
Similar Demographics by Median Earnings
Demographics Similar to Soviet Union by Median Earnings
In terms of median earnings, the demographic groups most similar to Soviet Union are Immigrants from Sweden ($54,478, a difference of 0.35%), Immigrants from Korea ($54,530, a difference of 0.44%), Burmese ($54,559, a difference of 0.50%), Cypriot ($54,589, a difference of 0.55%), and Turkish ($53,919, a difference of 0.69%).
| Demographics | Rating | Rank | Median Earnings |
| Eastern Europeans | 100.0 /100 | #17 | Exceptional $55,084 |
| Immigrants | Japan | 100.0 /100 | #18 | Exceptional $54,938 |
| Immigrants | Belgium | 100.0 /100 | #19 | Exceptional $54,679 |
| Cypriots | 100.0 /100 | #20 | Exceptional $54,589 |
| Burmese | 100.0 /100 | #21 | Exceptional $54,559 |
| Immigrants | Korea | 100.0 /100 | #22 | Exceptional $54,530 |
| Immigrants | Sweden | 100.0 /100 | #23 | Exceptional $54,478 |
| Soviet Union | 100.0 /100 | #24 | Exceptional $54,290 |
| Turks | 100.0 /100 | #25 | Exceptional $53,919 |
| Immigrants | Northern Europe | 100.0 /100 | #26 | Exceptional $53,872 |
| Asians | 100.0 /100 | #27 | Exceptional $53,690 |
| Immigrants | France | 100.0 /100 | #28 | Exceptional $53,490 |
| Immigrants | Russia | 100.0 /100 | #29 | Exceptional $53,457 |
| Cambodians | 100.0 /100 | #30 | Exceptional $53,386 |
| Russians | 100.0 /100 | #31 | Exceptional $53,334 |
Demographics Similar to Italians by Median Earnings
In terms of median earnings, the demographic groups most similar to Italians are Macedonian ($49,893, a difference of 0.040%), Immigrants from Argentina ($49,841, a difference of 0.15%), Armenian ($49,804, a difference of 0.22%), Croatian ($49,724, a difference of 0.38%), and Immigrants from North America ($50,108, a difference of 0.39%).
| Demographics | Rating | Rank | Median Earnings |
| Romanians | 99.5 /100 | #83 | Exceptional $50,244 |
| Immigrants | Hungary | 99.5 /100 | #84 | Exceptional $50,227 |
| Immigrants | Kazakhstan | 99.5 /100 | #85 | Exceptional $50,225 |
| Immigrants | Canada | 99.5 /100 | #86 | Exceptional $50,192 |
| Immigrants | Uzbekistan | 99.5 /100 | #87 | Exceptional $50,151 |
| Albanians | 99.4 /100 | #88 | Exceptional $50,116 |
| Immigrants | North America | 99.4 /100 | #89 | Exceptional $50,108 |
| Italians | 99.3 /100 | #90 | Exceptional $49,915 |
| Macedonians | 99.2 /100 | #91 | Exceptional $49,893 |
| Immigrants | Argentina | 99.2 /100 | #92 | Exceptional $49,841 |
| Armenians | 99.1 /100 | #93 | Exceptional $49,804 |
| Croatians | 99.0 /100 | #94 | Exceptional $49,724 |
| Immigrants | England | 99.0 /100 | #95 | Exceptional $49,722 |
| Immigrants | Lebanon | 99.0 /100 | #96 | Exceptional $49,682 |
| Immigrants | North Macedonia | 98.9 /100 | #97 | Exceptional $49,658 |