Portuguese vs Italian Median Earnings
COMPARE
Portuguese
Italian
Median Earnings
Median Earnings Comparison
Portuguese
Italians
$48,032
MEDIAN EARNINGS
90.4/ 100
METRIC RATING
135th/ 347
METRIC RANK
$49,915
MEDIAN EARNINGS
99.3/ 100
METRIC RATING
90th/ 347
METRIC RANK
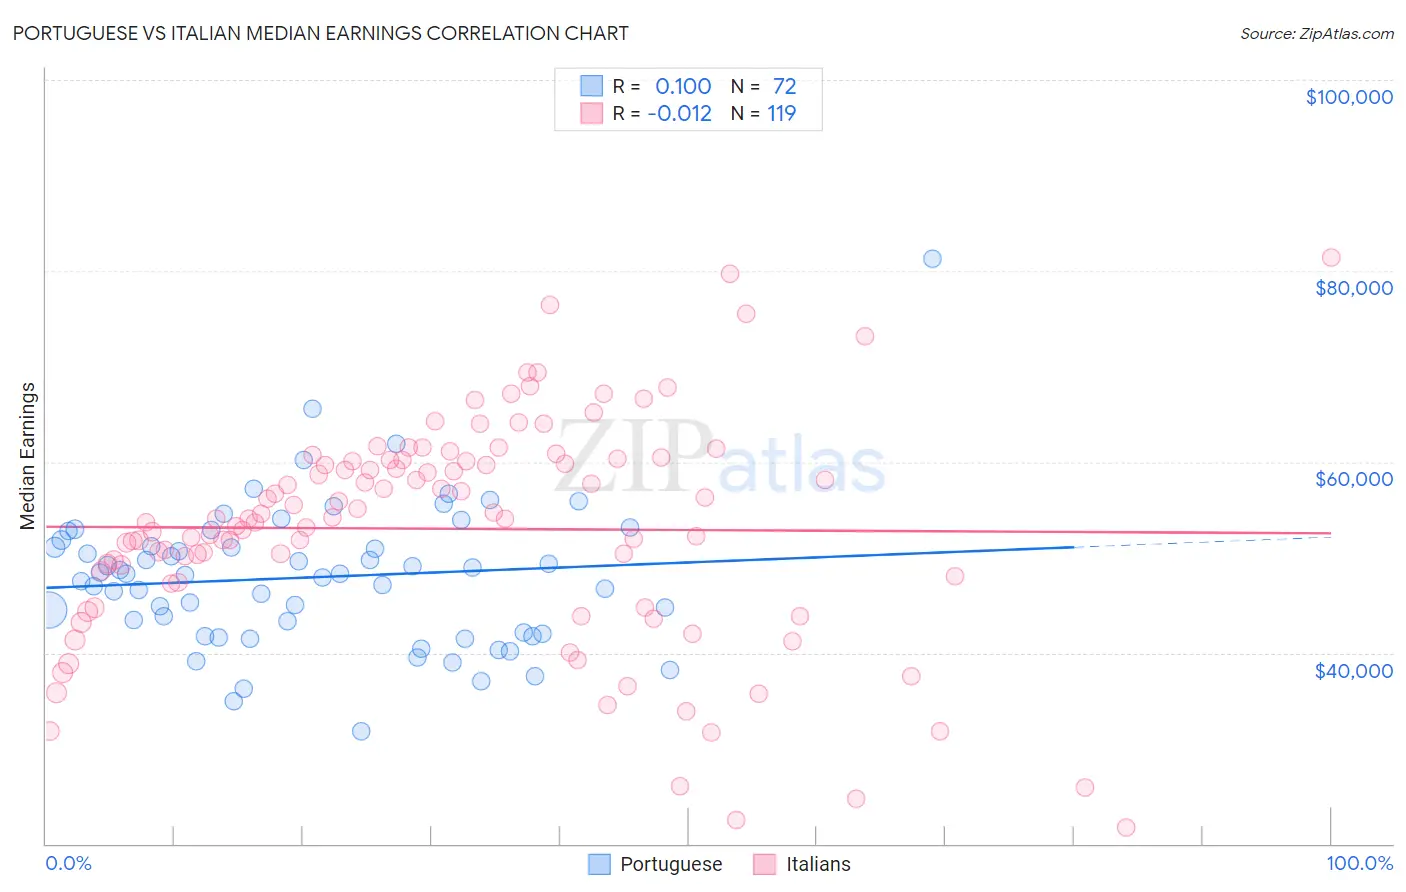
Portuguese vs Italian Median Earnings Correlation Chart
The statistical analysis conducted on geographies consisting of 450,292,594 people shows a poor positive correlation between the proportion of Portuguese and median earnings in the United States with a correlation coefficient (R) of 0.100 and weighted average of $48,032. Similarly, the statistical analysis conducted on geographies consisting of 574,669,176 people shows no correlation between the proportion of Italians and median earnings in the United States with a correlation coefficient (R) of -0.012 and weighted average of $49,915, a difference of 3.9%.
Median Earnings Correlation Summary
| Measurement | Portuguese | Italian |
| Minimum | $31,738 | $21,728 |
| Maximum | $81,250 | $81,458 |
| Range | $49,512 | $59,730 |
| Mean | $47,922 | $52,992 |
| Median | $48,184 | $54,091 |
| Interquartile 25% (IQ1) | $42,050 | $47,401 |
| Interquartile 75% (IQ3) | $51,472 | $60,200 |
| Interquartile Range (IQR) | $9,423 | $12,799 |
| Standard Deviation (Sample) | $7,646 | $11,690 |
| Standard Deviation (Population) | $7,593 | $11,640 |
Similar Demographics by Median Earnings
Demographics Similar to Portuguese by Median Earnings
In terms of median earnings, the demographic groups most similar to Portuguese are Immigrants from Uganda ($48,041, a difference of 0.020%), Sri Lankan ($48,040, a difference of 0.020%), Slovene ($47,995, a difference of 0.080%), Immigrants from Nepal ($47,925, a difference of 0.22%), and European ($47,915, a difference of 0.25%).
| Demographics | Rating | Rank | Median Earnings |
| Immigrants | Philippines | 92.9 /100 | #128 | Exceptional $48,266 |
| Pakistanis | 92.8 /100 | #129 | Exceptional $48,254 |
| Zimbabweans | 92.6 /100 | #130 | Exceptional $48,229 |
| Lebanese | 92.5 /100 | #131 | Exceptional $48,226 |
| British | 92.2 /100 | #132 | Exceptional $48,189 |
| Immigrants | Uganda | 90.5 /100 | #133 | Exceptional $48,041 |
| Sri Lankans | 90.5 /100 | #134 | Exceptional $48,040 |
| Portuguese | 90.4 /100 | #135 | Exceptional $48,032 |
| Slovenes | 90.0 /100 | #136 | Excellent $47,995 |
| Immigrants | Nepal | 89.0 /100 | #137 | Excellent $47,925 |
| Europeans | 88.9 /100 | #138 | Excellent $47,915 |
| Canadians | 88.8 /100 | #139 | Excellent $47,911 |
| Taiwanese | 88.7 /100 | #140 | Excellent $47,902 |
| Immigrants | Sierra Leone | 88.3 /100 | #141 | Excellent $47,875 |
| Ugandans | 88.0 /100 | #142 | Excellent $47,854 |
Demographics Similar to Italians by Median Earnings
In terms of median earnings, the demographic groups most similar to Italians are Macedonian ($49,893, a difference of 0.040%), Immigrants from Argentina ($49,841, a difference of 0.15%), Armenian ($49,804, a difference of 0.22%), Croatian ($49,724, a difference of 0.38%), and Immigrants from North America ($50,108, a difference of 0.39%).
| Demographics | Rating | Rank | Median Earnings |
| Romanians | 99.5 /100 | #83 | Exceptional $50,244 |
| Immigrants | Hungary | 99.5 /100 | #84 | Exceptional $50,227 |
| Immigrants | Kazakhstan | 99.5 /100 | #85 | Exceptional $50,225 |
| Immigrants | Canada | 99.5 /100 | #86 | Exceptional $50,192 |
| Immigrants | Uzbekistan | 99.5 /100 | #87 | Exceptional $50,151 |
| Albanians | 99.4 /100 | #88 | Exceptional $50,116 |
| Immigrants | North America | 99.4 /100 | #89 | Exceptional $50,108 |
| Italians | 99.3 /100 | #90 | Exceptional $49,915 |
| Macedonians | 99.2 /100 | #91 | Exceptional $49,893 |
| Immigrants | Argentina | 99.2 /100 | #92 | Exceptional $49,841 |
| Armenians | 99.1 /100 | #93 | Exceptional $49,804 |
| Croatians | 99.0 /100 | #94 | Exceptional $49,724 |
| Immigrants | England | 99.0 /100 | #95 | Exceptional $49,722 |
| Immigrants | Lebanon | 99.0 /100 | #96 | Exceptional $49,682 |
| Immigrants | North Macedonia | 98.9 /100 | #97 | Exceptional $49,658 |