Bolivian vs Italian Median Earnings
COMPARE
Bolivian
Italian
Median Earnings
Median Earnings Comparison
Bolivians
Italians
$52,005
MEDIAN EARNINGS
100.0/ 100
METRIC RATING
49th/ 347
METRIC RANK
$49,915
MEDIAN EARNINGS
99.3/ 100
METRIC RATING
90th/ 347
METRIC RANK
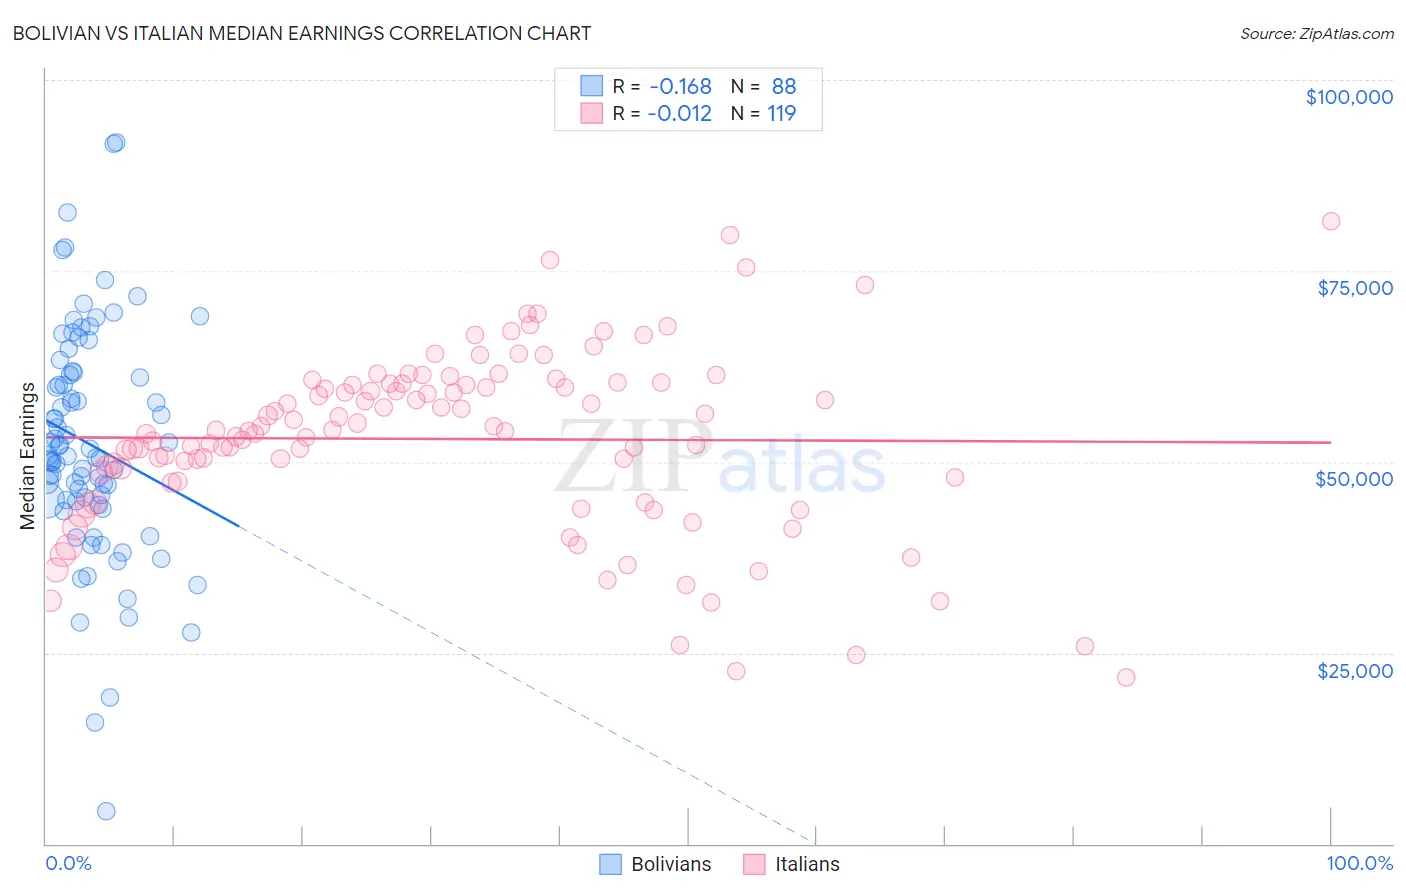
Bolivian vs Italian Median Earnings Correlation Chart
The statistical analysis conducted on geographies consisting of 184,675,536 people shows a poor negative correlation between the proportion of Bolivians and median earnings in the United States with a correlation coefficient (R) of -0.168 and weighted average of $52,005. Similarly, the statistical analysis conducted on geographies consisting of 574,669,176 people shows no correlation between the proportion of Italians and median earnings in the United States with a correlation coefficient (R) of -0.012 and weighted average of $49,915, a difference of 4.2%.
Median Earnings Correlation Summary
| Measurement | Bolivian | Italian |
| Minimum | $4,250 | $21,728 |
| Maximum | $91,786 | $81,458 |
| Range | $87,536 | $59,730 |
| Mean | $52,342 | $52,992 |
| Median | $50,729 | $54,091 |
| Interquartile 25% (IQ1) | $44,853 | $47,401 |
| Interquartile 75% (IQ3) | $61,590 | $60,200 |
| Interquartile Range (IQR) | $16,737 | $12,799 |
| Standard Deviation (Sample) | $15,104 | $11,690 |
| Standard Deviation (Population) | $15,018 | $11,640 |
Similar Demographics by Median Earnings
Demographics Similar to Bolivians by Median Earnings
In terms of median earnings, the demographic groups most similar to Bolivians are Immigrants from South Africa ($51,850, a difference of 0.30%), Immigrants from Austria ($51,826, a difference of 0.35%), Immigrants from Europe ($52,195, a difference of 0.37%), Estonian ($51,772, a difference of 0.45%), and Immigrants from Norway ($51,758, a difference of 0.48%).
| Demographics | Rating | Rank | Median Earnings |
| Maltese | 100.0 /100 | #42 | Exceptional $52,526 |
| Immigrants | Malaysia | 100.0 /100 | #43 | Exceptional $52,514 |
| Bulgarians | 100.0 /100 | #44 | Exceptional $52,512 |
| Immigrants | Czechoslovakia | 100.0 /100 | #45 | Exceptional $52,361 |
| Bhutanese | 100.0 /100 | #46 | Exceptional $52,297 |
| Australians | 100.0 /100 | #47 | Exceptional $52,294 |
| Immigrants | Europe | 100.0 /100 | #48 | Exceptional $52,195 |
| Bolivians | 100.0 /100 | #49 | Exceptional $52,005 |
| Immigrants | South Africa | 100.0 /100 | #50 | Exceptional $51,850 |
| Immigrants | Austria | 99.9 /100 | #51 | Exceptional $51,826 |
| Estonians | 99.9 /100 | #52 | Exceptional $51,772 |
| Immigrants | Norway | 99.9 /100 | #53 | Exceptional $51,758 |
| Immigrants | Indonesia | 99.9 /100 | #54 | Exceptional $51,715 |
| Egyptians | 99.9 /100 | #55 | Exceptional $51,701 |
| Immigrants | Pakistan | 99.9 /100 | #56 | Exceptional $51,693 |
Demographics Similar to Italians by Median Earnings
In terms of median earnings, the demographic groups most similar to Italians are Macedonian ($49,893, a difference of 0.040%), Immigrants from Argentina ($49,841, a difference of 0.15%), Armenian ($49,804, a difference of 0.22%), Croatian ($49,724, a difference of 0.38%), and Immigrants from North America ($50,108, a difference of 0.39%).
| Demographics | Rating | Rank | Median Earnings |
| Romanians | 99.5 /100 | #83 | Exceptional $50,244 |
| Immigrants | Hungary | 99.5 /100 | #84 | Exceptional $50,227 |
| Immigrants | Kazakhstan | 99.5 /100 | #85 | Exceptional $50,225 |
| Immigrants | Canada | 99.5 /100 | #86 | Exceptional $50,192 |
| Immigrants | Uzbekistan | 99.5 /100 | #87 | Exceptional $50,151 |
| Albanians | 99.4 /100 | #88 | Exceptional $50,116 |
| Immigrants | North America | 99.4 /100 | #89 | Exceptional $50,108 |
| Italians | 99.3 /100 | #90 | Exceptional $49,915 |
| Macedonians | 99.2 /100 | #91 | Exceptional $49,893 |
| Immigrants | Argentina | 99.2 /100 | #92 | Exceptional $49,841 |
| Armenians | 99.1 /100 | #93 | Exceptional $49,804 |
| Croatians | 99.0 /100 | #94 | Exceptional $49,724 |
| Immigrants | England | 99.0 /100 | #95 | Exceptional $49,722 |
| Immigrants | Lebanon | 99.0 /100 | #96 | Exceptional $49,682 |
| Immigrants | North Macedonia | 98.9 /100 | #97 | Exceptional $49,658 |