Soviet Union vs Cajun Median Earnings
COMPARE
Soviet Union
Cajun
Median Earnings
Median Earnings Comparison
Soviet Union
Cajuns
$54,290
MEDIAN EARNINGS
100.0/ 100
METRIC RATING
24th/ 347
METRIC RANK
$42,189
MEDIAN EARNINGS
0.3/ 100
METRIC RATING
278th/ 347
METRIC RANK
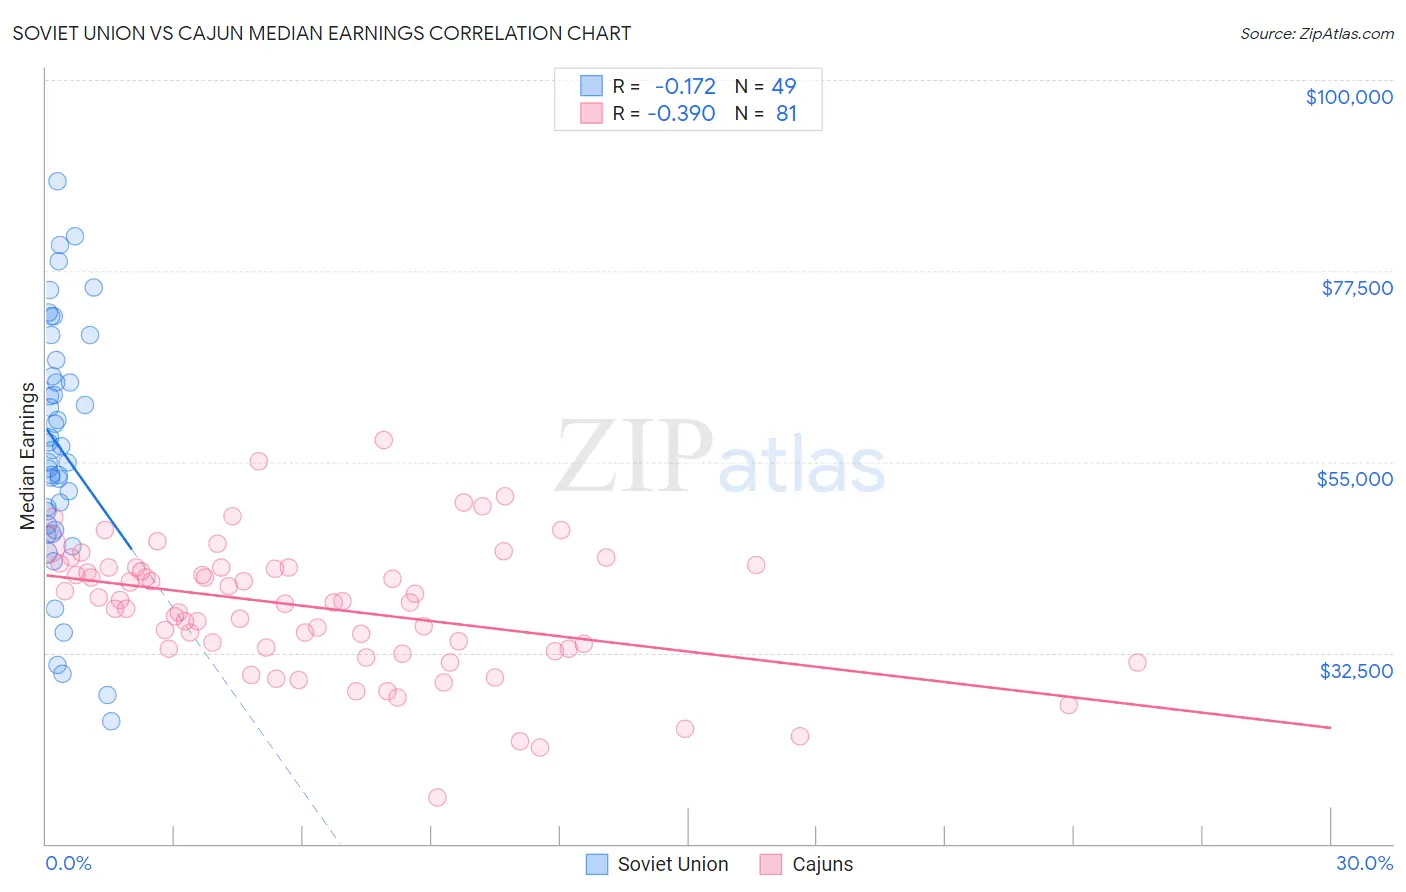
Soviet Union vs Cajun Median Earnings Correlation Chart
The statistical analysis conducted on geographies consisting of 43,511,973 people shows a poor negative correlation between the proportion of Soviet Union and median earnings in the United States with a correlation coefficient (R) of -0.172 and weighted average of $54,290. Similarly, the statistical analysis conducted on geographies consisting of 149,692,940 people shows a mild negative correlation between the proportion of Cajuns and median earnings in the United States with a correlation coefficient (R) of -0.390 and weighted average of $42,189, a difference of 28.7%.
Median Earnings Correlation Summary
| Measurement | Soviet Union | Cajun |
| Minimum | $24,432 | $15,451 |
| Maximum | $88,077 | $57,514 |
| Range | $63,645 | $42,063 |
| Mean | $56,673 | $37,817 |
| Median | $56,451 | $38,499 |
| Interquartile 25% (IQ1) | $47,287 | $32,952 |
| Interquartile 75% (IQ3) | $65,993 | $42,585 |
| Interquartile Range (IQR) | $18,706 | $9,633 |
| Standard Deviation (Sample) | $14,478 | $7,734 |
| Standard Deviation (Population) | $14,329 | $7,686 |
Similar Demographics by Median Earnings
Demographics Similar to Soviet Union by Median Earnings
In terms of median earnings, the demographic groups most similar to Soviet Union are Immigrants from Sweden ($54,478, a difference of 0.35%), Immigrants from Korea ($54,530, a difference of 0.44%), Burmese ($54,559, a difference of 0.50%), Cypriot ($54,589, a difference of 0.55%), and Turkish ($53,919, a difference of 0.69%).
| Demographics | Rating | Rank | Median Earnings |
| Eastern Europeans | 100.0 /100 | #17 | Exceptional $55,084 |
| Immigrants | Japan | 100.0 /100 | #18 | Exceptional $54,938 |
| Immigrants | Belgium | 100.0 /100 | #19 | Exceptional $54,679 |
| Cypriots | 100.0 /100 | #20 | Exceptional $54,589 |
| Burmese | 100.0 /100 | #21 | Exceptional $54,559 |
| Immigrants | Korea | 100.0 /100 | #22 | Exceptional $54,530 |
| Immigrants | Sweden | 100.0 /100 | #23 | Exceptional $54,478 |
| Soviet Union | 100.0 /100 | #24 | Exceptional $54,290 |
| Turks | 100.0 /100 | #25 | Exceptional $53,919 |
| Immigrants | Northern Europe | 100.0 /100 | #26 | Exceptional $53,872 |
| Asians | 100.0 /100 | #27 | Exceptional $53,690 |
| Immigrants | France | 100.0 /100 | #28 | Exceptional $53,490 |
| Immigrants | Russia | 100.0 /100 | #29 | Exceptional $53,457 |
| Cambodians | 100.0 /100 | #30 | Exceptional $53,386 |
| Russians | 100.0 /100 | #31 | Exceptional $53,334 |
Demographics Similar to Cajuns by Median Earnings
In terms of median earnings, the demographic groups most similar to Cajuns are Colville ($42,151, a difference of 0.090%), Hmong ($42,111, a difference of 0.19%), Central American ($42,280, a difference of 0.21%), Spanish American ($42,316, a difference of 0.30%), and Immigrants from Belize ($42,339, a difference of 0.36%).
| Demographics | Rating | Rank | Median Earnings |
| Pennsylvania Germans | 0.5 /100 | #271 | Tragic $42,615 |
| Iroquois | 0.4 /100 | #272 | Tragic $42,430 |
| Immigrants | Dominica | 0.4 /100 | #273 | Tragic $42,420 |
| Immigrants | El Salvador | 0.4 /100 | #274 | Tragic $42,413 |
| Immigrants | Belize | 0.3 /100 | #275 | Tragic $42,339 |
| Spanish Americans | 0.3 /100 | #276 | Tragic $42,316 |
| Central Americans | 0.3 /100 | #277 | Tragic $42,280 |
| Cajuns | 0.3 /100 | #278 | Tragic $42,189 |
| Colville | 0.2 /100 | #279 | Tragic $42,151 |
| Hmong | 0.2 /100 | #280 | Tragic $42,111 |
| Marshallese | 0.2 /100 | #281 | Tragic $41,969 |
| Africans | 0.2 /100 | #282 | Tragic $41,955 |
| Dominicans | 0.2 /100 | #283 | Tragic $41,864 |
| Blackfeet | 0.2 /100 | #284 | Tragic $41,822 |
| Immigrants | Nicaragua | 0.1 /100 | #285 | Tragic $41,737 |