Soviet Union vs Immigrants from Dominica Median Earnings
COMPARE
Soviet Union
Immigrants from Dominica
Median Earnings
Median Earnings Comparison
Soviet Union
Immigrants from Dominica
$54,290
MEDIAN EARNINGS
100.0/ 100
METRIC RATING
24th/ 347
METRIC RANK
$42,420
MEDIAN EARNINGS
0.4/ 100
METRIC RATING
273rd/ 347
METRIC RANK
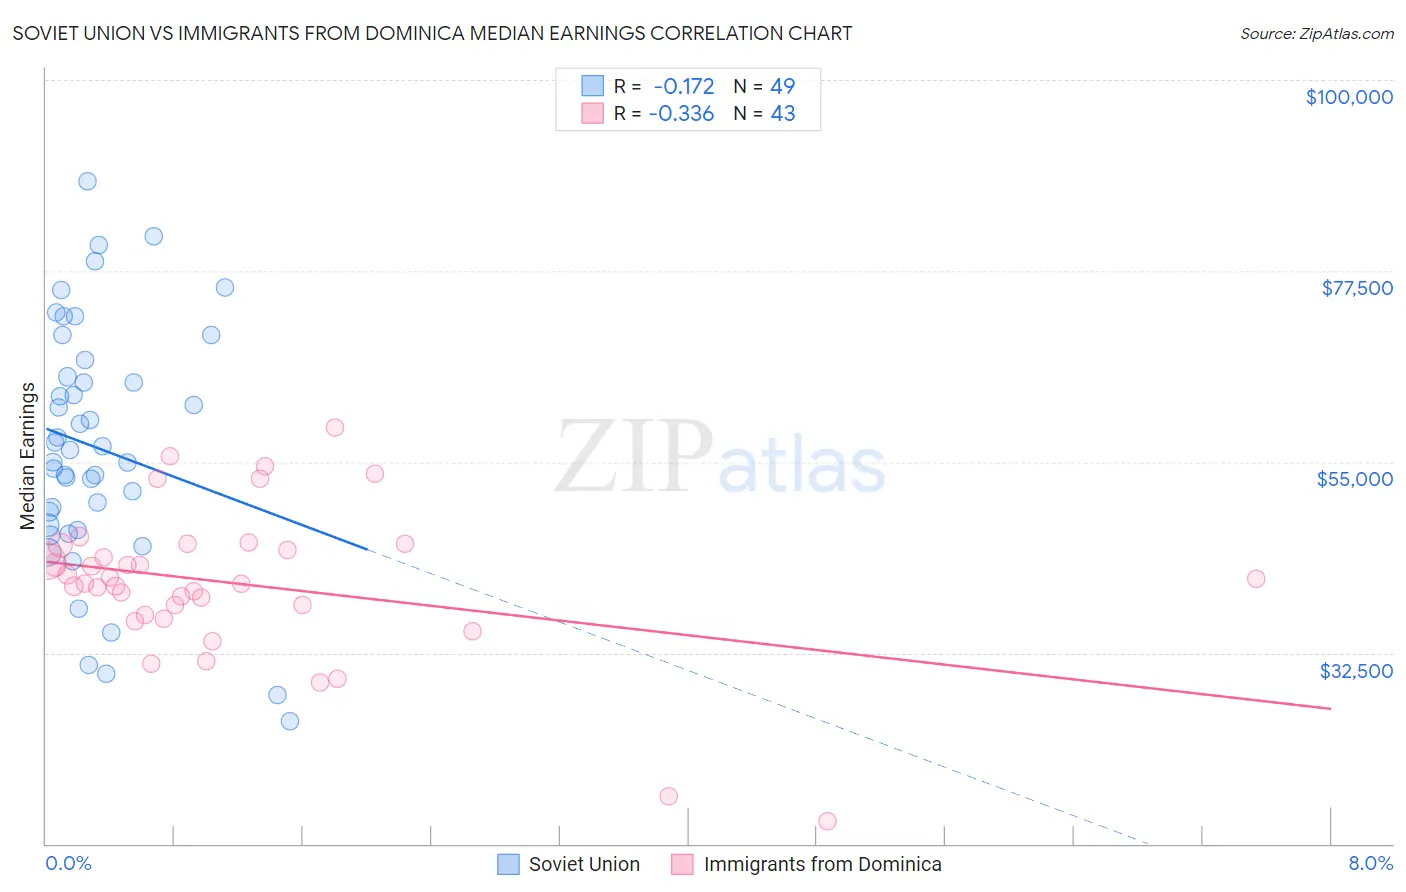
Soviet Union vs Immigrants from Dominica Median Earnings Correlation Chart
The statistical analysis conducted on geographies consisting of 43,511,973 people shows a poor negative correlation between the proportion of Soviet Union and median earnings in the United States with a correlation coefficient (R) of -0.172 and weighted average of $54,290. Similarly, the statistical analysis conducted on geographies consisting of 83,794,141 people shows a mild negative correlation between the proportion of Immigrants from Dominica and median earnings in the United States with a correlation coefficient (R) of -0.336 and weighted average of $42,420, a difference of 28.0%.
Median Earnings Correlation Summary
| Measurement | Soviet Union | Immigrants from Dominica |
| Minimum | $24,432 | $12,717 |
| Maximum | $88,077 | $59,056 |
| Range | $63,645 | $46,339 |
| Mean | $56,673 | $40,644 |
| Median | $56,451 | $40,628 |
| Interquartile 25% (IQ1) | $47,287 | $36,948 |
| Interquartile 75% (IQ3) | $65,993 | $45,188 |
| Interquartile Range (IQR) | $18,706 | $8,240 |
| Standard Deviation (Sample) | $14,478 | $8,982 |
| Standard Deviation (Population) | $14,329 | $8,876 |
Similar Demographics by Median Earnings
Demographics Similar to Soviet Union by Median Earnings
In terms of median earnings, the demographic groups most similar to Soviet Union are Immigrants from Sweden ($54,478, a difference of 0.35%), Immigrants from Korea ($54,530, a difference of 0.44%), Burmese ($54,559, a difference of 0.50%), Cypriot ($54,589, a difference of 0.55%), and Turkish ($53,919, a difference of 0.69%).
| Demographics | Rating | Rank | Median Earnings |
| Eastern Europeans | 100.0 /100 | #17 | Exceptional $55,084 |
| Immigrants | Japan | 100.0 /100 | #18 | Exceptional $54,938 |
| Immigrants | Belgium | 100.0 /100 | #19 | Exceptional $54,679 |
| Cypriots | 100.0 /100 | #20 | Exceptional $54,589 |
| Burmese | 100.0 /100 | #21 | Exceptional $54,559 |
| Immigrants | Korea | 100.0 /100 | #22 | Exceptional $54,530 |
| Immigrants | Sweden | 100.0 /100 | #23 | Exceptional $54,478 |
| Soviet Union | 100.0 /100 | #24 | Exceptional $54,290 |
| Turks | 100.0 /100 | #25 | Exceptional $53,919 |
| Immigrants | Northern Europe | 100.0 /100 | #26 | Exceptional $53,872 |
| Asians | 100.0 /100 | #27 | Exceptional $53,690 |
| Immigrants | France | 100.0 /100 | #28 | Exceptional $53,490 |
| Immigrants | Russia | 100.0 /100 | #29 | Exceptional $53,457 |
| Cambodians | 100.0 /100 | #30 | Exceptional $53,386 |
| Russians | 100.0 /100 | #31 | Exceptional $53,334 |
Demographics Similar to Immigrants from Dominica by Median Earnings
In terms of median earnings, the demographic groups most similar to Immigrants from Dominica are Immigrants from El Salvador ($42,413, a difference of 0.020%), Iroquois ($42,430, a difference of 0.030%), Immigrants from Belize ($42,339, a difference of 0.19%), Spanish American ($42,316, a difference of 0.25%), and Central American ($42,280, a difference of 0.33%).
| Demographics | Rating | Rank | Median Earnings |
| Immigrants | Laos | 0.7 /100 | #266 | Tragic $42,884 |
| Cree | 0.6 /100 | #267 | Tragic $42,777 |
| Americans | 0.6 /100 | #268 | Tragic $42,742 |
| Belizeans | 0.5 /100 | #269 | Tragic $42,702 |
| Osage | 0.5 /100 | #270 | Tragic $42,651 |
| Pennsylvania Germans | 0.5 /100 | #271 | Tragic $42,615 |
| Iroquois | 0.4 /100 | #272 | Tragic $42,430 |
| Immigrants | Dominica | 0.4 /100 | #273 | Tragic $42,420 |
| Immigrants | El Salvador | 0.4 /100 | #274 | Tragic $42,413 |
| Immigrants | Belize | 0.3 /100 | #275 | Tragic $42,339 |
| Spanish Americans | 0.3 /100 | #276 | Tragic $42,316 |
| Central Americans | 0.3 /100 | #277 | Tragic $42,280 |
| Cajuns | 0.3 /100 | #278 | Tragic $42,189 |
| Colville | 0.2 /100 | #279 | Tragic $42,151 |
| Hmong | 0.2 /100 | #280 | Tragic $42,111 |