Soviet Union vs Immigrants from Barbados Median Earnings
COMPARE
Soviet Union
Immigrants from Barbados
Median Earnings
Median Earnings Comparison
Soviet Union
Immigrants from Barbados
$54,290
MEDIAN EARNINGS
100.0/ 100
METRIC RATING
24th/ 347
METRIC RANK
$45,816
MEDIAN EARNINGS
29.6/ 100
METRIC RATING
199th/ 347
METRIC RANK
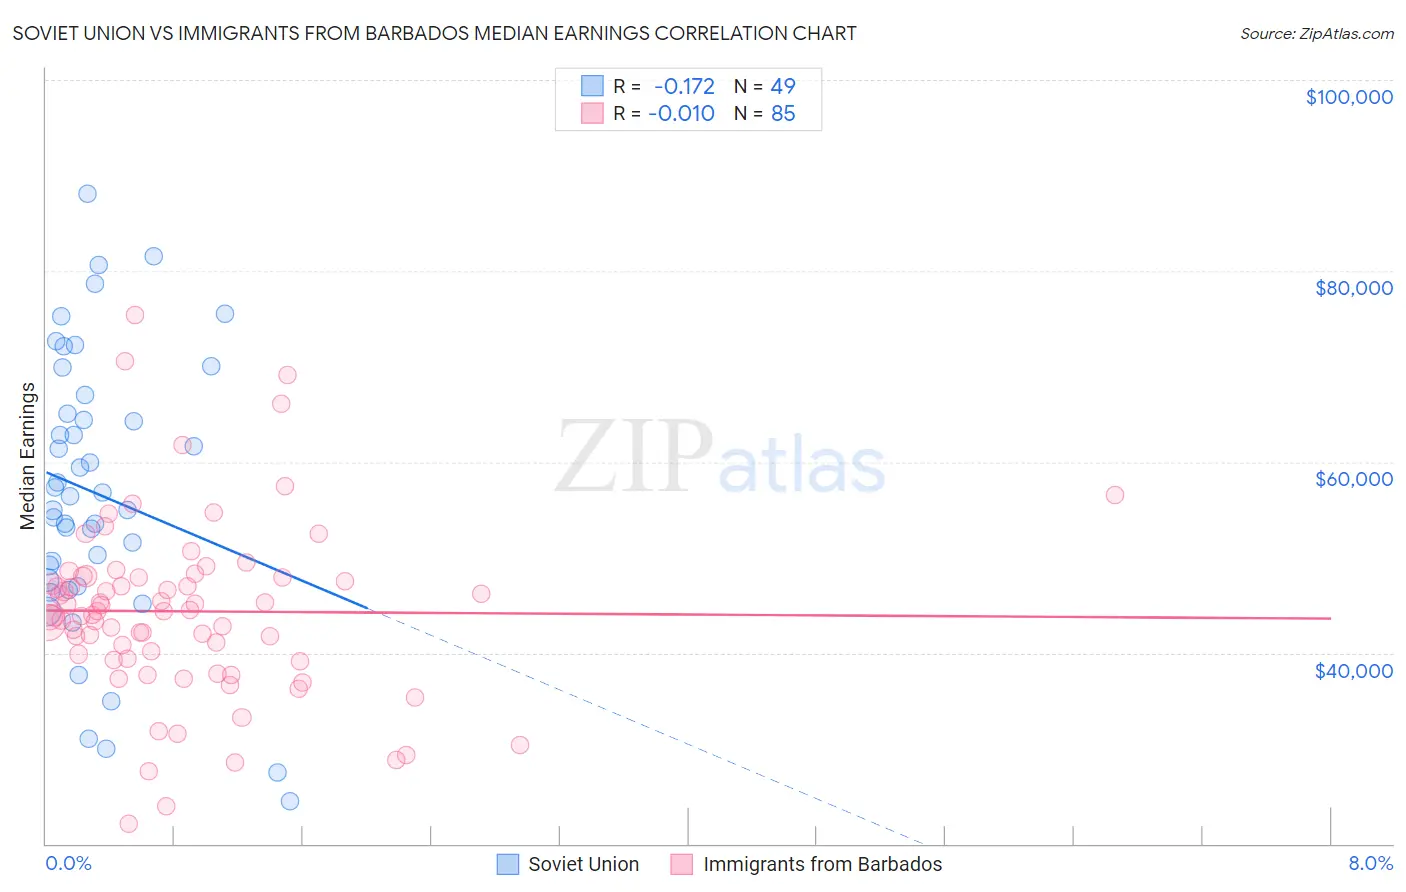
Soviet Union vs Immigrants from Barbados Median Earnings Correlation Chart
The statistical analysis conducted on geographies consisting of 43,511,973 people shows a poor negative correlation between the proportion of Soviet Union and median earnings in the United States with a correlation coefficient (R) of -0.172 and weighted average of $54,290. Similarly, the statistical analysis conducted on geographies consisting of 112,759,497 people shows no correlation between the proportion of Immigrants from Barbados and median earnings in the United States with a correlation coefficient (R) of -0.010 and weighted average of $45,816, a difference of 18.5%.
Median Earnings Correlation Summary
| Measurement | Soviet Union | Immigrants from Barbados |
| Minimum | $24,432 | $22,067 |
| Maximum | $88,077 | $75,335 |
| Range | $63,645 | $53,268 |
| Mean | $56,673 | $44,348 |
| Median | $56,451 | $44,360 |
| Interquartile 25% (IQ1) | $47,287 | $39,293 |
| Interquartile 75% (IQ3) | $65,993 | $47,976 |
| Interquartile Range (IQR) | $18,706 | $8,683 |
| Standard Deviation (Sample) | $14,478 | $9,386 |
| Standard Deviation (Population) | $14,329 | $9,331 |
Similar Demographics by Median Earnings
Demographics Similar to Soviet Union by Median Earnings
In terms of median earnings, the demographic groups most similar to Soviet Union are Immigrants from Sweden ($54,478, a difference of 0.35%), Immigrants from Korea ($54,530, a difference of 0.44%), Burmese ($54,559, a difference of 0.50%), Cypriot ($54,589, a difference of 0.55%), and Turkish ($53,919, a difference of 0.69%).
| Demographics | Rating | Rank | Median Earnings |
| Eastern Europeans | 100.0 /100 | #17 | Exceptional $55,084 |
| Immigrants | Japan | 100.0 /100 | #18 | Exceptional $54,938 |
| Immigrants | Belgium | 100.0 /100 | #19 | Exceptional $54,679 |
| Cypriots | 100.0 /100 | #20 | Exceptional $54,589 |
| Burmese | 100.0 /100 | #21 | Exceptional $54,559 |
| Immigrants | Korea | 100.0 /100 | #22 | Exceptional $54,530 |
| Immigrants | Sweden | 100.0 /100 | #23 | Exceptional $54,478 |
| Soviet Union | 100.0 /100 | #24 | Exceptional $54,290 |
| Turks | 100.0 /100 | #25 | Exceptional $53,919 |
| Immigrants | Northern Europe | 100.0 /100 | #26 | Exceptional $53,872 |
| Asians | 100.0 /100 | #27 | Exceptional $53,690 |
| Immigrants | France | 100.0 /100 | #28 | Exceptional $53,490 |
| Immigrants | Russia | 100.0 /100 | #29 | Exceptional $53,457 |
| Cambodians | 100.0 /100 | #30 | Exceptional $53,386 |
| Russians | 100.0 /100 | #31 | Exceptional $53,334 |
Demographics Similar to Immigrants from Barbados by Median Earnings
In terms of median earnings, the demographic groups most similar to Immigrants from Barbados are Trinidadian and Tobagonian ($45,820, a difference of 0.010%), Immigrants from the Azores ($45,812, a difference of 0.010%), Barbadian ($45,846, a difference of 0.060%), Yugoslavian ($45,846, a difference of 0.070%), and Celtic ($45,732, a difference of 0.18%).
| Demographics | Rating | Rank | Median Earnings |
| Germans | 33.2 /100 | #192 | Fair $45,935 |
| Guamanians/Chamorros | 33.2 /100 | #193 | Fair $45,933 |
| Immigrants | Costa Rica | 33.0 /100 | #194 | Fair $45,928 |
| Immigrants | St. Vincent and the Grenadines | 32.4 /100 | #195 | Fair $45,908 |
| Yugoslavians | 30.5 /100 | #196 | Fair $45,846 |
| Barbadians | 30.5 /100 | #197 | Fair $45,846 |
| Trinidadians and Tobagonians | 29.7 /100 | #198 | Fair $45,820 |
| Immigrants | Barbados | 29.6 /100 | #199 | Fair $45,816 |
| Immigrants | Azores | 29.5 /100 | #200 | Fair $45,812 |
| Celtics | 27.2 /100 | #201 | Fair $45,732 |
| Immigrants | Trinidad and Tobago | 27.1 /100 | #202 | Fair $45,729 |
| Welsh | 26.6 /100 | #203 | Fair $45,710 |
| Immigrants | Uruguay | 25.9 /100 | #204 | Fair $45,682 |
| Tongans | 25.4 /100 | #205 | Fair $45,665 |
| Immigrants | Ghana | 24.8 /100 | #206 | Fair $45,641 |