Soviet Union vs Immigrants from Nepal Median Earnings
COMPARE
Soviet Union
Immigrants from Nepal
Median Earnings
Median Earnings Comparison
Soviet Union
Immigrants from Nepal
$54,290
MEDIAN EARNINGS
100.0/ 100
METRIC RATING
24th/ 347
METRIC RANK
$47,925
MEDIAN EARNINGS
89.0/ 100
METRIC RATING
137th/ 347
METRIC RANK
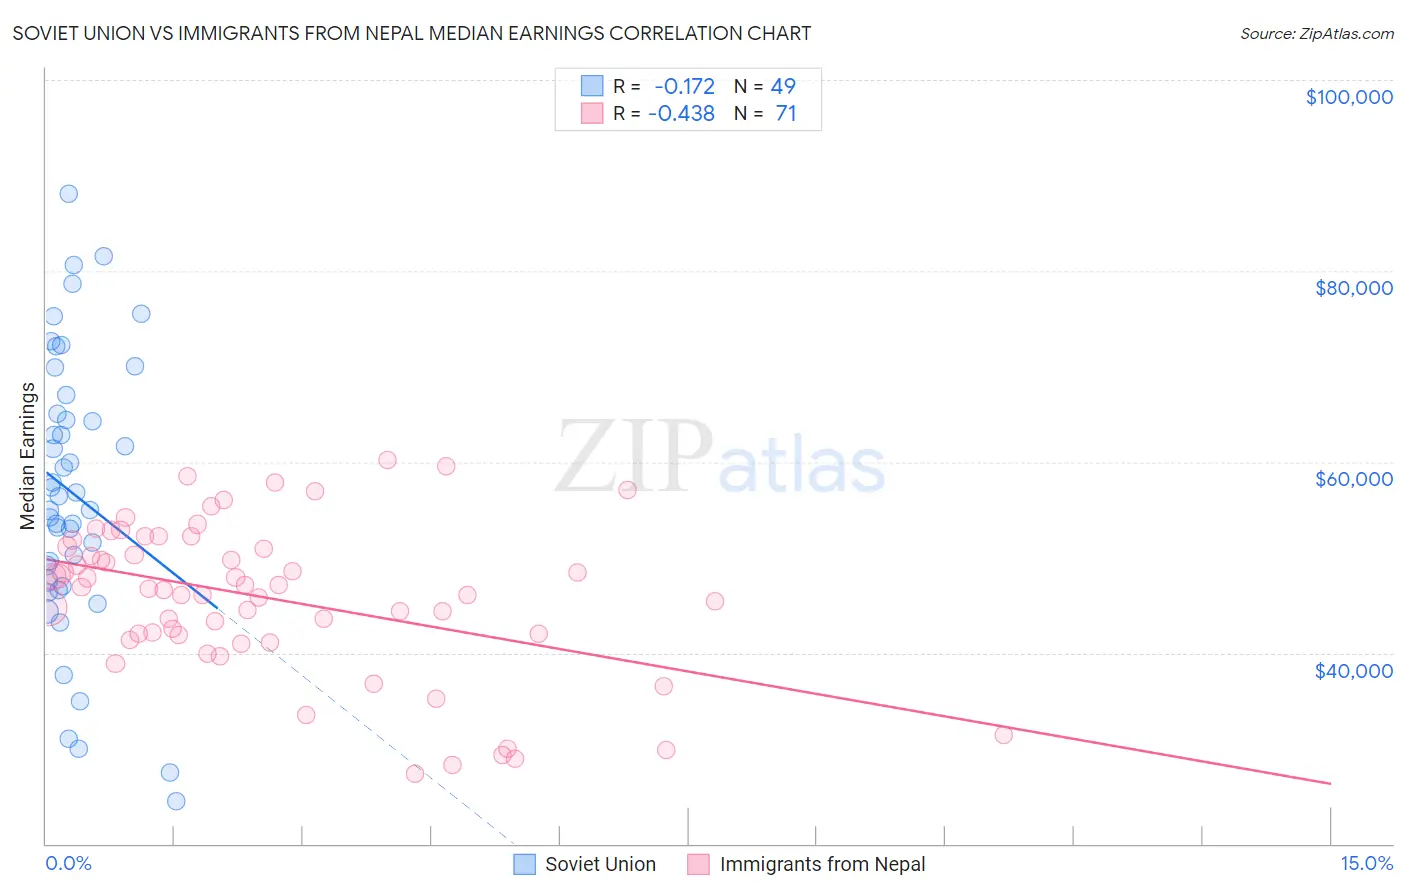
Soviet Union vs Immigrants from Nepal Median Earnings Correlation Chart
The statistical analysis conducted on geographies consisting of 43,511,973 people shows a poor negative correlation between the proportion of Soviet Union and median earnings in the United States with a correlation coefficient (R) of -0.172 and weighted average of $54,290. Similarly, the statistical analysis conducted on geographies consisting of 186,786,511 people shows a moderate negative correlation between the proportion of Immigrants from Nepal and median earnings in the United States with a correlation coefficient (R) of -0.438 and weighted average of $47,925, a difference of 13.3%.
Median Earnings Correlation Summary
| Measurement | Soviet Union | Immigrants from Nepal |
| Minimum | $24,432 | $27,307 |
| Maximum | $88,077 | $60,227 |
| Range | $63,645 | $32,920 |
| Mean | $56,673 | $45,713 |
| Median | $56,451 | $46,771 |
| Interquartile 25% (IQ1) | $47,287 | $41,930 |
| Interquartile 75% (IQ3) | $65,993 | $51,099 |
| Interquartile Range (IQR) | $18,706 | $9,169 |
| Standard Deviation (Sample) | $14,478 | $7,950 |
| Standard Deviation (Population) | $14,329 | $7,894 |
Similar Demographics by Median Earnings
Demographics Similar to Soviet Union by Median Earnings
In terms of median earnings, the demographic groups most similar to Soviet Union are Immigrants from Sweden ($54,478, a difference of 0.35%), Immigrants from Korea ($54,530, a difference of 0.44%), Burmese ($54,559, a difference of 0.50%), Cypriot ($54,589, a difference of 0.55%), and Turkish ($53,919, a difference of 0.69%).
| Demographics | Rating | Rank | Median Earnings |
| Eastern Europeans | 100.0 /100 | #17 | Exceptional $55,084 |
| Immigrants | Japan | 100.0 /100 | #18 | Exceptional $54,938 |
| Immigrants | Belgium | 100.0 /100 | #19 | Exceptional $54,679 |
| Cypriots | 100.0 /100 | #20 | Exceptional $54,589 |
| Burmese | 100.0 /100 | #21 | Exceptional $54,559 |
| Immigrants | Korea | 100.0 /100 | #22 | Exceptional $54,530 |
| Immigrants | Sweden | 100.0 /100 | #23 | Exceptional $54,478 |
| Soviet Union | 100.0 /100 | #24 | Exceptional $54,290 |
| Turks | 100.0 /100 | #25 | Exceptional $53,919 |
| Immigrants | Northern Europe | 100.0 /100 | #26 | Exceptional $53,872 |
| Asians | 100.0 /100 | #27 | Exceptional $53,690 |
| Immigrants | France | 100.0 /100 | #28 | Exceptional $53,490 |
| Immigrants | Russia | 100.0 /100 | #29 | Exceptional $53,457 |
| Cambodians | 100.0 /100 | #30 | Exceptional $53,386 |
| Russians | 100.0 /100 | #31 | Exceptional $53,334 |
Demographics Similar to Immigrants from Nepal by Median Earnings
In terms of median earnings, the demographic groups most similar to Immigrants from Nepal are European ($47,915, a difference of 0.020%), Canadian ($47,911, a difference of 0.030%), Taiwanese ($47,902, a difference of 0.050%), Immigrants from Sierra Leone ($47,875, a difference of 0.11%), and Slovene ($47,995, a difference of 0.15%).
| Demographics | Rating | Rank | Median Earnings |
| Zimbabweans | 92.6 /100 | #130 | Exceptional $48,229 |
| Lebanese | 92.5 /100 | #131 | Exceptional $48,226 |
| British | 92.2 /100 | #132 | Exceptional $48,189 |
| Immigrants | Uganda | 90.5 /100 | #133 | Exceptional $48,041 |
| Sri Lankans | 90.5 /100 | #134 | Exceptional $48,040 |
| Portuguese | 90.4 /100 | #135 | Exceptional $48,032 |
| Slovenes | 90.0 /100 | #136 | Excellent $47,995 |
| Immigrants | Nepal | 89.0 /100 | #137 | Excellent $47,925 |
| Europeans | 88.9 /100 | #138 | Excellent $47,915 |
| Canadians | 88.8 /100 | #139 | Excellent $47,911 |
| Taiwanese | 88.7 /100 | #140 | Excellent $47,902 |
| Immigrants | Sierra Leone | 88.3 /100 | #141 | Excellent $47,875 |
| Ugandans | 88.0 /100 | #142 | Excellent $47,854 |
| Swedes | 88.0 /100 | #143 | Excellent $47,851 |
| Hungarians | 87.1 /100 | #144 | Excellent $47,795 |