South American vs Immigrants from Eritrea 10th Grade
COMPARE
South American
Immigrants from Eritrea
10th Grade
10th Grade Comparison
South Americans
Immigrants from Eritrea
92.8%
10TH GRADE
0.9/ 100
METRIC RATING
252nd/ 347
METRIC RANK
92.5%
10TH GRADE
0.3/ 100
METRIC RATING
271st/ 347
METRIC RANK
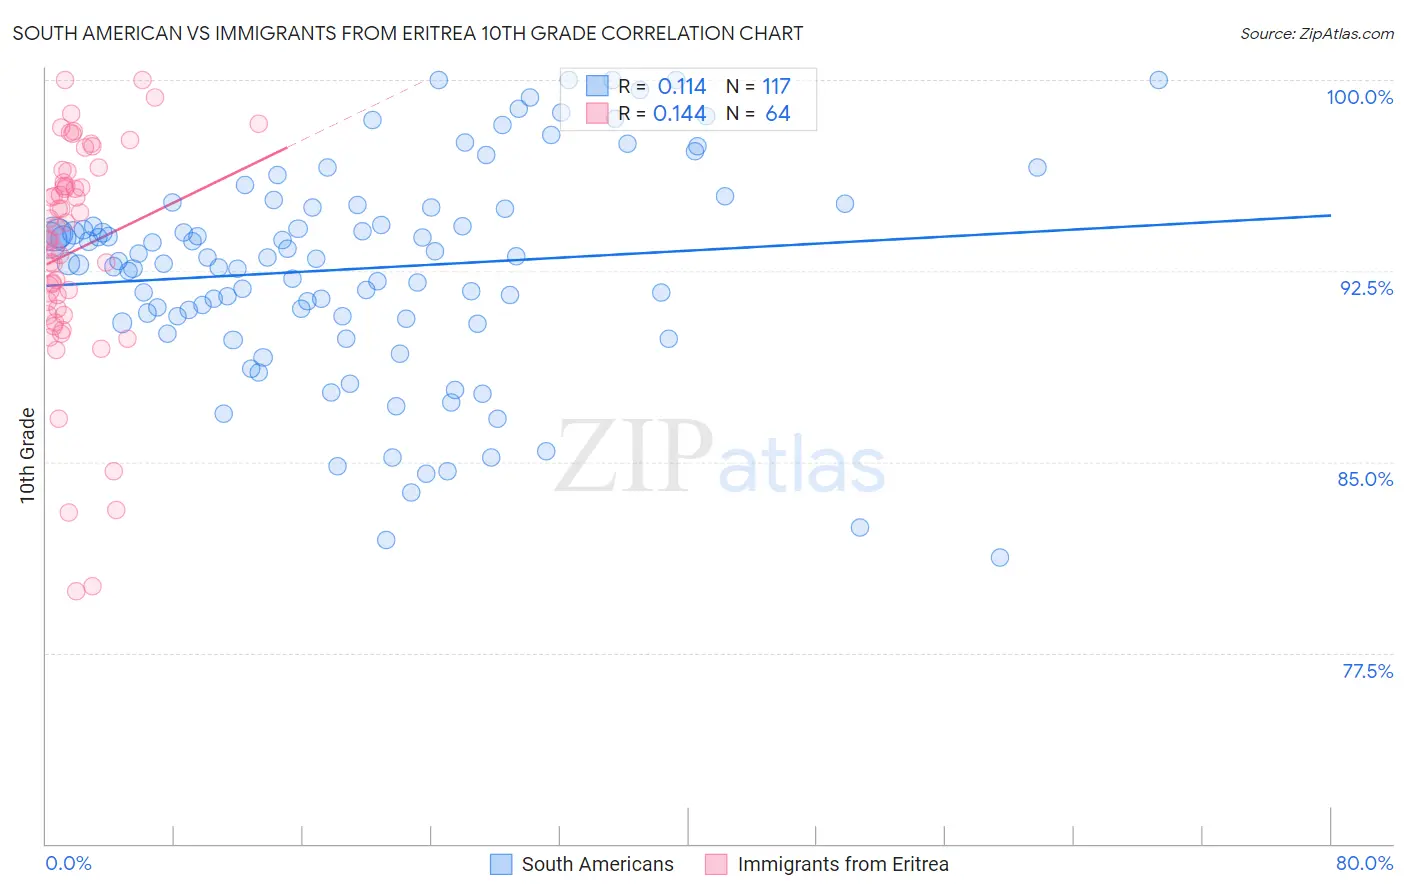
South American vs Immigrants from Eritrea 10th Grade Correlation Chart
The statistical analysis conducted on geographies consisting of 494,065,729 people shows a poor positive correlation between the proportion of South Americans and percentage of population with at least 10th grade education in the United States with a correlation coefficient (R) of 0.114 and weighted average of 92.8%. Similarly, the statistical analysis conducted on geographies consisting of 104,754,230 people shows a poor positive correlation between the proportion of Immigrants from Eritrea and percentage of population with at least 10th grade education in the United States with a correlation coefficient (R) of 0.144 and weighted average of 92.5%, a difference of 0.26%.
10th Grade Correlation Summary
| Measurement | South American | Immigrants from Eritrea |
| Minimum | 81.2% | 79.9% |
| Maximum | 100.0% | 100.0% |
| Range | 18.7% | 20.1% |
| Mean | 92.6% | 93.3% |
| Median | 93.0% | 94.0% |
| Interquartile 25% (IQ1) | 90.7% | 90.9% |
| Interquartile 75% (IQ3) | 95.0% | 96.2% |
| Interquartile Range (IQR) | 4.3% | 5.3% |
| Standard Deviation (Sample) | 4.1% | 4.4% |
| Standard Deviation (Population) | 4.1% | 4.4% |
Demographics Similar to South Americans and Immigrants from Eritrea by 10th Grade
In terms of 10th grade, the demographic groups most similar to South Americans are Ghanaian (92.8%, a difference of 0.0%), Immigrants from Thailand (92.8%, a difference of 0.010%), Armenian (92.7%, a difference of 0.010%), Immigrants from Bolivia (92.7%, a difference of 0.060%), and Immigrants from Nigeria (92.7%, a difference of 0.070%). Similarly, the demographic groups most similar to Immigrants from Eritrea are Immigrants from Uruguay (92.5%, a difference of 0.010%), Immigrants from Colombia (92.5%, a difference of 0.020%), Taiwanese (92.5%, a difference of 0.030%), Immigrants from Ghana (92.5%, a difference of 0.030%), and Immigrants from Philippines (92.6%, a difference of 0.040%).
| Demographics | Rating | Rank | 10th Grade |
| Immigrants | Thailand | 1.0 /100 | #251 | Tragic 92.8% |
| South Americans | 0.9 /100 | #252 | Tragic 92.8% |
| Ghanaians | 0.9 /100 | #253 | Tragic 92.8% |
| Armenians | 0.9 /100 | #254 | Tragic 92.7% |
| Immigrants | Bolivia | 0.7 /100 | #255 | Tragic 92.7% |
| Immigrants | Nigeria | 0.7 /100 | #256 | Tragic 92.7% |
| U.S. Virgin Islanders | 0.7 /100 | #257 | Tragic 92.7% |
| Immigrants | Costa Rica | 0.6 /100 | #258 | Tragic 92.7% |
| Immigrants | Jamaica | 0.5 /100 | #259 | Tragic 92.6% |
| Immigrants | Uzbekistan | 0.5 /100 | #260 | Tragic 92.6% |
| Paiute | 0.4 /100 | #261 | Tragic 92.6% |
| Immigrants | South America | 0.4 /100 | #262 | Tragic 92.6% |
| Apache | 0.4 /100 | #263 | Tragic 92.6% |
| Peruvians | 0.4 /100 | #264 | Tragic 92.6% |
| Dutch West Indians | 0.4 /100 | #265 | Tragic 92.6% |
| Immigrants | Philippines | 0.4 /100 | #266 | Tragic 92.6% |
| Taiwanese | 0.3 /100 | #267 | Tragic 92.5% |
| Immigrants | Ghana | 0.3 /100 | #268 | Tragic 92.5% |
| Immigrants | Colombia | 0.3 /100 | #269 | Tragic 92.5% |
| Immigrants | Uruguay | 0.3 /100 | #270 | Tragic 92.5% |
| Immigrants | Eritrea | 0.3 /100 | #271 | Tragic 92.5% |