Somali vs Japanese Disability Age 65 to 74
COMPARE
Somali
Japanese
Disability Age 65 to 74
Disability Age 65 to 74 Comparison
Somalis
Japanese
25.1%
DISABILITY AGE 65 TO 74
0.6/ 100
METRIC RATING
254th/ 347
METRIC RANK
25.7%
DISABILITY AGE 65 TO 74
0.1/ 100
METRIC RATING
273rd/ 347
METRIC RANK
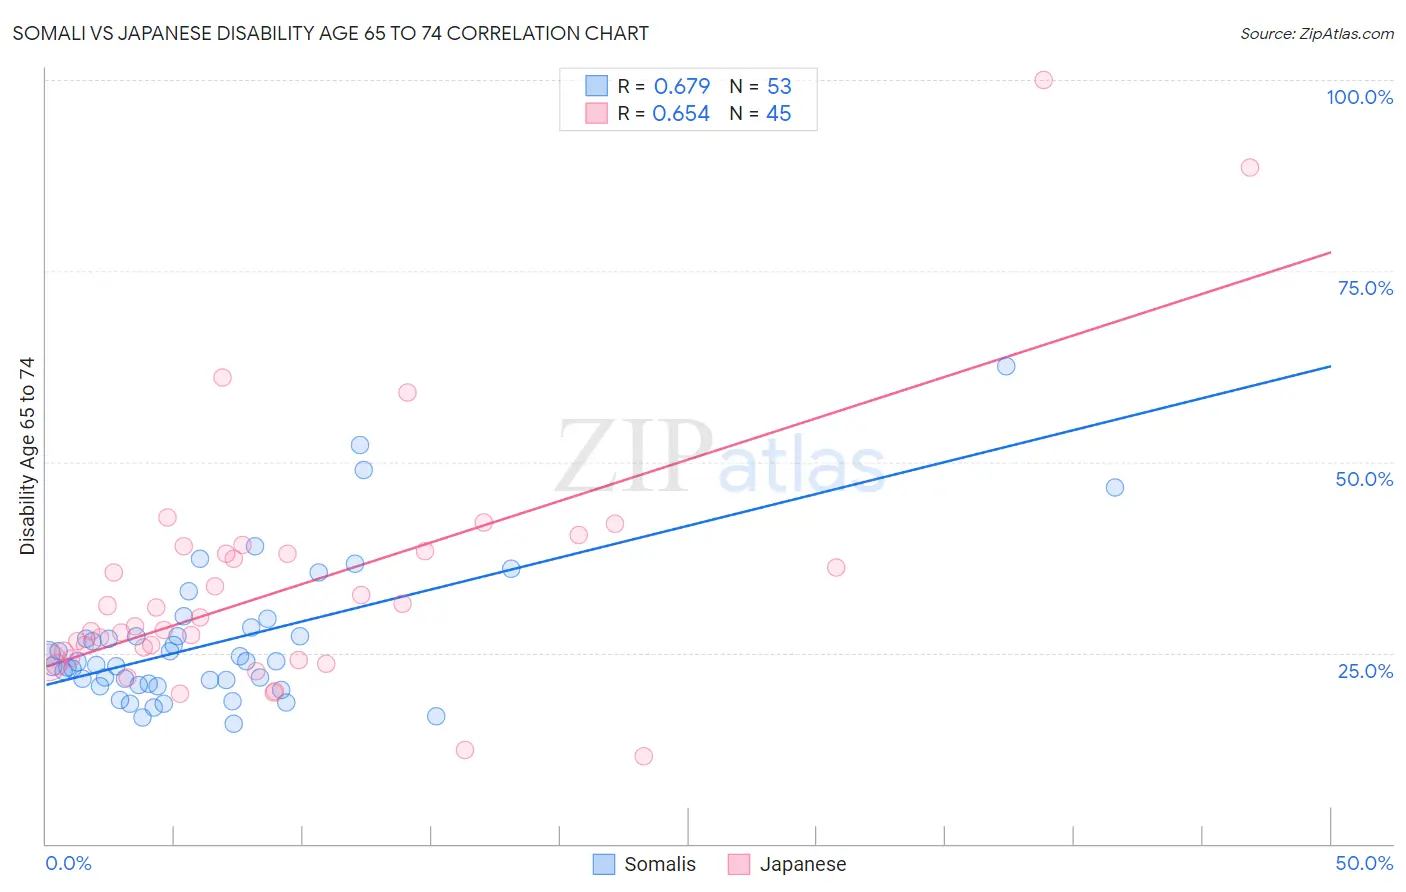
Somali vs Japanese Disability Age 65 to 74 Correlation Chart
The statistical analysis conducted on geographies consisting of 99,200,116 people shows a significant positive correlation between the proportion of Somalis and percentage of population with a disability between the ages 65 and 75 in the United States with a correlation coefficient (R) of 0.679 and weighted average of 25.1%. Similarly, the statistical analysis conducted on geographies consisting of 248,828,802 people shows a significant positive correlation between the proportion of Japanese and percentage of population with a disability between the ages 65 and 75 in the United States with a correlation coefficient (R) of 0.654 and weighted average of 25.7%, a difference of 2.5%.
Disability Age 65 to 74 Correlation Summary
| Measurement | Somali | Japanese |
| Minimum | 15.7% | 11.5% |
| Maximum | 62.5% | 100.0% |
| Range | 46.8% | 88.5% |
| Mean | 26.5% | 33.5% |
| Median | 23.8% | 28.5% |
| Interquartile 25% (IQ1) | 20.9% | 24.2% |
| Interquartile 75% (IQ3) | 27.8% | 38.1% |
| Interquartile Range (IQR) | 6.9% | 13.9% |
| Standard Deviation (Sample) | 9.4% | 16.5% |
| Standard Deviation (Population) | 9.3% | 16.4% |
Demographics Similar to Somalis and Japanese by Disability Age 65 to 74
In terms of disability age 65 to 74, the demographic groups most similar to Somalis are Subsaharan African (25.1%, a difference of 0.080%), Central American (25.1%, a difference of 0.16%), Immigrants from Somalia (25.2%, a difference of 0.57%), Guamanian/Chamorro (25.3%, a difference of 0.75%), and Marshallese (25.3%, a difference of 0.80%). Similarly, the demographic groups most similar to Japanese are Immigrants from Liberia (25.7%, a difference of 0.13%), Immigrants from Dominica (25.7%, a difference of 0.13%), Immigrants from Guatemala (25.7%, a difference of 0.16%), Hmong (25.7%, a difference of 0.24%), and Liberian (25.6%, a difference of 0.36%).
| Demographics | Rating | Rank | Disability Age 65 to 74 |
| Sub-Saharan Africans | 0.6 /100 | #253 | Tragic 25.1% |
| Somalis | 0.6 /100 | #254 | Tragic 25.1% |
| Central Americans | 0.5 /100 | #255 | Tragic 25.1% |
| Immigrants | Somalia | 0.4 /100 | #256 | Tragic 25.2% |
| Guamanians/Chamorros | 0.3 /100 | #257 | Tragic 25.3% |
| Marshallese | 0.3 /100 | #258 | Tragic 25.3% |
| Immigrants | Cambodia | 0.3 /100 | #259 | Tragic 25.3% |
| Malaysians | 0.2 /100 | #260 | Tragic 25.4% |
| Cape Verdeans | 0.2 /100 | #261 | Tragic 25.4% |
| Samoans | 0.2 /100 | #262 | Tragic 25.4% |
| Iroquois | 0.2 /100 | #263 | Tragic 25.4% |
| Hawaiians | 0.2 /100 | #264 | Tragic 25.5% |
| Guatemalans | 0.2 /100 | #265 | Tragic 25.5% |
| Immigrants | Latin America | 0.1 /100 | #266 | Tragic 25.6% |
| Ottawa | 0.1 /100 | #267 | Tragic 25.6% |
| Liberians | 0.1 /100 | #268 | Tragic 25.6% |
| Hmong | 0.1 /100 | #269 | Tragic 25.7% |
| Immigrants | Guatemala | 0.1 /100 | #270 | Tragic 25.7% |
| Immigrants | Liberia | 0.1 /100 | #271 | Tragic 25.7% |
| Immigrants | Dominica | 0.1 /100 | #272 | Tragic 25.7% |
| Japanese | 0.1 /100 | #273 | Tragic 25.7% |