Immigrants from North Macedonia vs Tongan Per Capita Income
COMPARE
Immigrants from North Macedonia
Tongan
Per Capita Income
Per Capita Income Comparison
Immigrants from North Macedonia
Tongans
$45,622
PER CAPITA INCOME
90.0/ 100
METRIC RATING
131st/ 347
METRIC RANK
$41,693
PER CAPITA INCOME
9.9/ 100
METRIC RATING
216th/ 347
METRIC RANK
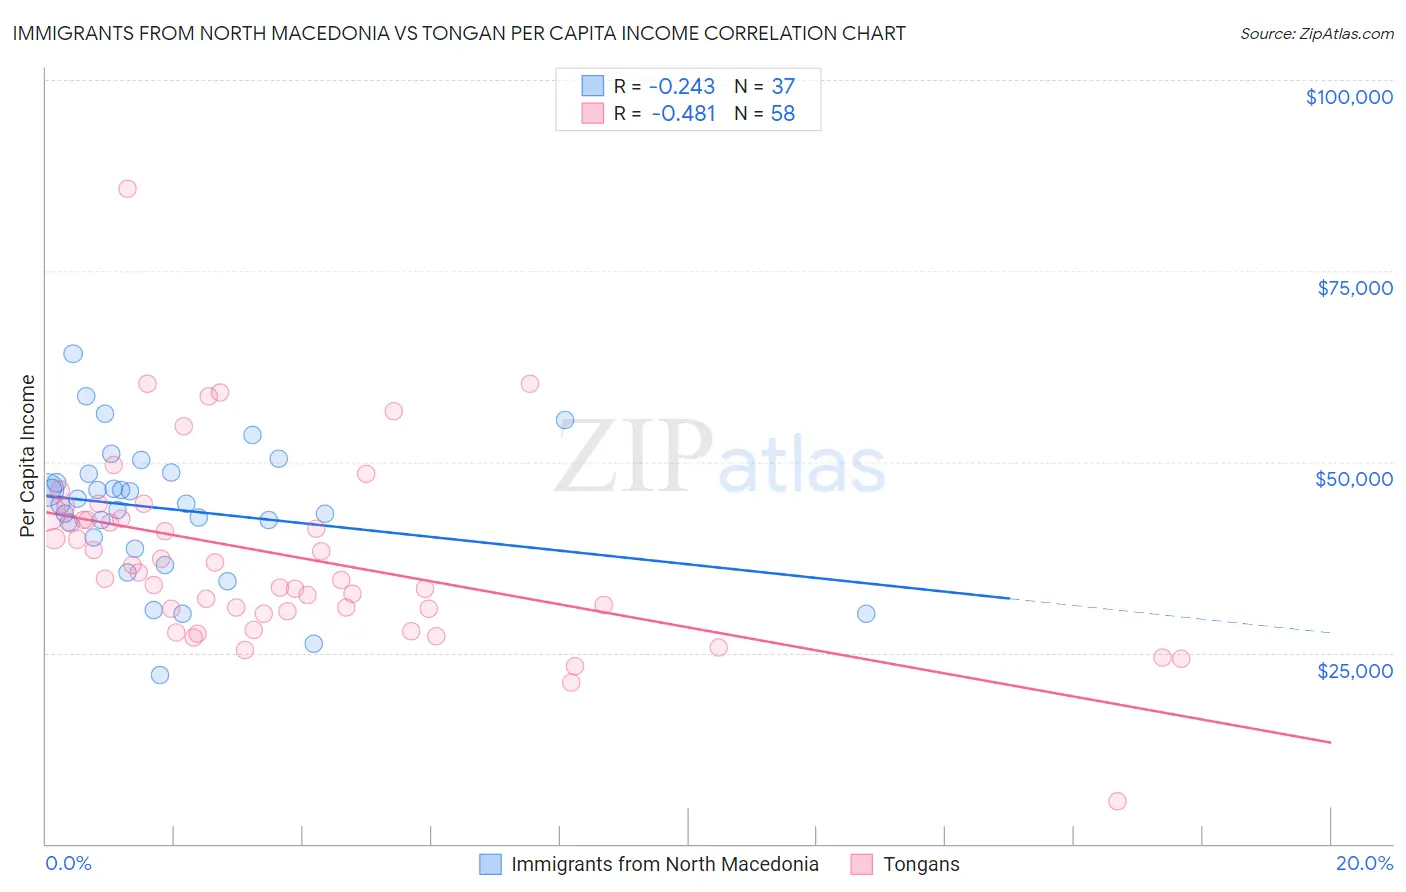
Immigrants from North Macedonia vs Tongan Per Capita Income Correlation Chart
The statistical analysis conducted on geographies consisting of 74,060,501 people shows a weak negative correlation between the proportion of Immigrants from North Macedonia and per capita income in the United States with a correlation coefficient (R) of -0.243 and weighted average of $45,622. Similarly, the statistical analysis conducted on geographies consisting of 102,908,385 people shows a moderate negative correlation between the proportion of Tongans and per capita income in the United States with a correlation coefficient (R) of -0.481 and weighted average of $41,693, a difference of 9.4%.
Per Capita Income Correlation Summary
| Measurement | Immigrants from North Macedonia | Tongan |
| Minimum | $22,118 | $5,622 |
| Maximum | $64,214 | $85,704 |
| Range | $42,096 | $80,082 |
| Mean | $43,782 | $37,644 |
| Median | $44,497 | $35,100 |
| Interquartile 25% (IQ1) | $39,397 | $30,397 |
| Interquartile 75% (IQ3) | $48,508 | $42,507 |
| Interquartile Range (IQR) | $9,111 | $12,110 |
| Standard Deviation (Sample) | $8,887 | $12,429 |
| Standard Deviation (Population) | $8,766 | $12,321 |
Similar Demographics by Per Capita Income
Demographics Similar to Immigrants from North Macedonia by Per Capita Income
In terms of per capita income, the demographic groups most similar to Immigrants from North Macedonia are Jordanian ($45,605, a difference of 0.040%), Pakistani ($45,587, a difference of 0.080%), Luxembourger ($45,663, a difference of 0.090%), Arab ($45,662, a difference of 0.090%), and Slovene ($45,581, a difference of 0.090%).
| Demographics | Rating | Rank | Per Capita Income |
| Europeans | 92.0 /100 | #124 | Exceptional $45,836 |
| Zimbabweans | 91.7 /100 | #125 | Exceptional $45,804 |
| Palestinians | 91.6 /100 | #126 | Exceptional $45,790 |
| Immigrants | Germany | 91.3 /100 | #127 | Exceptional $45,751 |
| Swedes | 91.3 /100 | #128 | Exceptional $45,750 |
| Luxembourgers | 90.4 /100 | #129 | Exceptional $45,663 |
| Arabs | 90.4 /100 | #130 | Exceptional $45,662 |
| Immigrants | North Macedonia | 90.0 /100 | #131 | Exceptional $45,622 |
| Jordanians | 89.9 /100 | #132 | Excellent $45,605 |
| Pakistanis | 89.7 /100 | #133 | Excellent $45,587 |
| Slovenes | 89.6 /100 | #134 | Excellent $45,581 |
| Hungarians | 87.9 /100 | #135 | Excellent $45,426 |
| Immigrants | Oceania | 85.2 /100 | #136 | Excellent $45,220 |
| Immigrants | Syria | 85.2 /100 | #137 | Excellent $45,218 |
| Assyrians/Chaldeans/Syriacs | 84.8 /100 | #138 | Excellent $45,195 |
Demographics Similar to Tongans by Per Capita Income
In terms of per capita income, the demographic groups most similar to Tongans are Sudanese ($41,695, a difference of 0.010%), Guamanian/Chamorro ($41,678, a difference of 0.030%), Immigrants from Bangladesh ($41,709, a difference of 0.040%), Immigrants from Venezuela ($41,727, a difference of 0.080%), and Trinidadian and Tobagonian ($41,655, a difference of 0.090%).
| Demographics | Rating | Rank | Per Capita Income |
| Immigrants | Sudan | 13.2 /100 | #209 | Poor $41,986 |
| Ecuadorians | 12.9 /100 | #210 | Poor $41,958 |
| Immigrants | Panama | 11.6 /100 | #211 | Poor $41,853 |
| Immigrants | Senegal | 11.3 /100 | #212 | Poor $41,830 |
| Immigrants | Venezuela | 10.2 /100 | #213 | Poor $41,727 |
| Immigrants | Bangladesh | 10.1 /100 | #214 | Poor $41,709 |
| Sudanese | 9.9 /100 | #215 | Tragic $41,695 |
| Tongans | 9.9 /100 | #216 | Tragic $41,693 |
| Guamanians/Chamorros | 9.7 /100 | #217 | Tragic $41,678 |
| Trinidadians and Tobagonians | 9.5 /100 | #218 | Tragic $41,655 |
| Puget Sound Salish | 8.1 /100 | #219 | Tragic $41,495 |
| Immigrants | Barbados | 7.9 /100 | #220 | Tragic $41,478 |
| Immigrants | Trinidad and Tobago | 7.9 /100 | #221 | Tragic $41,476 |
| Immigrants | Iraq | 7.1 /100 | #222 | Tragic $41,365 |
| Immigrants | Cameroon | 6.8 /100 | #223 | Tragic $41,334 |